Configuration
How to configure Kiali to fit your needs.
The pages in this Configuration section describe most available options for
managing and customizing your Kiali installation.
Unless noted, it is assumed that you are using the Kiali operator and that you
are managing the Kiali installation through a Kiali CR. The provided YAML
snippets for configuring Kiali should be placed in your Kiali CR. For example,
the provided configuration snippet for setting up the Anonymous authentication
strategy is the following:
spec:
  auth:
    strategy: anonymous
You will need to take this YAML snippet and apply it to your Kiali CR. As an example, an almost minimal Kiali CR using the previous configuration snippet would be the following:
apiVersion: kiali.io/v1alpha1
kind: Kiali
metadata:
  namespace: kiali-namespace
  name: kiali
spec:
  istio_namespace: istio-system
  deployment:
    namespace: kiali-namespace
  auth:
    strategy: anonymous
Then, you can save the finished YAML file and apply it with kubectl apply -f.
It is recommended that you read
The Kiali CR
and the Example Install
pages of the Installation Guide for more information about using the Kiali CR.
Also, for reference, see Kiali CR Reference which documents all available options.
1 - Authentication Strategies
Choosing and configuring the appropriate authentication strategy.
Kiali supports five authentication mechanisms.
- The default authentication strategy for OpenShift clusters is
openshift.
- The default authentication strategy for all other Kubernetes clusters is
token.
All mechanisms other than anonymous support limiting per-user namespace access control.
Read the dedicated page of each authentication strategy to learn more.
1.1 - Anonymous strategy
Access Kiali with no authentication.
Introduction
The anonymous strategy removes any authentication requirement. Users will
have access to Kiali without providing any credentials.
Although the anonymous strategy doesn’t provide any access protection, it’s
valid for some use-cases. Some examples known from the community:
- Exposing Kiali through a reverse proxy, where the reverse proxy is providing a custom authentication mechanism.
- Exposing Kiali on an already limited network of trusted users.
- When Kiali is accessed through
kubectl port-forward or alike commands that allow usage of the cluster’s RBAC capabilities to limit access.
- When developing Kiali, where a developer has a private instance on his own machine.
It’s worth to emphasize that the anonymous
strategy will leave Kiali unsecured. If you are using this option, make sure
that Kiali is available only to trusted users, or access is protected by other
means.
Set-up
To use the anonymous strategy, use the following configuration in the Kiali CR:
spec:
  auth:
    strategy: anonymous
The anonymous strategy doesn’t have any additional configuration.
Access control
When using the anonymous strategy, the content displayed in Kiali is based on
the permissions of the Kiali service account. By default, the Kiali service
account has cluster wide access and will be able to display everything in the
cluster.
OpenShift
If you are running Kiali in OpenShift, access can be customized by changing
privileges to the Kiali ServiceAccount. For example, to reduce permissions to
individual namespaces, first, remove the cluster-wide permissions granted by
default:
oc delete clusterrolebindings kiali
Then grant the kiali role only in needed namespaces. For example:
oc adm policy add-role-to-user kiali system:serviceaccount:istio-system:kiali-service-account -n ${NAMESPACE}
View only
You can tell the Kiali Operator to install Kiali in “view only”
mode (this does work for either OpenShift or Kubernetes). You do this by
setting the view_only_mode to true in the Kiali CR, which
allows Kiali to read service mesh resources found in the cluster, but it does
not allow any change:
spec:
  deployment:
    view_only_mode: true
1.2 - Header strategy
Run Kiali behind a reverse proxy responsible for injecting the user’s token, or a token with impersonation.
Introduction
The header strategy assumes a reverse proxy is in front of Kiali, such as
OpenUnison or OAuth2 Proxy, injecting the user’s identity into each request to
Kiali as an Authorization header. This token can be an OpenID Connect
token or any other token the cluster recognizes.
In addition to a user token, the header strategy supports impersonation
headers. If the impersonation headers are present in the request, then Kiali
will act on behalf of the user specified by the impersonation (assuming the
token supplied in the Authorization header is authorized to do so).
The header strategy allows for namespace access control.
Set-up
The header strategy will work with any Kubernetes cluster. The token provided
must be supported by that cluster. For instance, most “on-prem” clusters support
OpenID Connect, but cloud hosted clusters do not. For clusters that don’t support
a token, the impersonation
headers can be injected by the reverse proxy.
spec:
  auth:
    strategy: header
The header strategy doesn’t have any additional configuration.
The header strategy looks for a token in the Authorization HTTP header with the
Bearer prefix. The HTTP header should look like:
Authorization: Bearer TOKEN
Where TOKEN is the appropriate token for your cluster. This TOKEN will be
submitted to the API server via a TokenReview to validate the token ONLY
on the first access to Kiali. On subsequent calls the TOKEN is passed through
directly to the API server.
Security Considerations
Network Policies
A policy should be put in place to make sure that the only “client” for Kiali is
the authenticating reverse proxy. This helps limit potential abuse and ensures
that the authenticating reverse proxy is the source of truth for who accessed
Kiali.
Short Lived Tokens
The authenticating reverse proxy should inject a short lived token in the
Authorization header. A shorter lived token is less likely to be abused if
leaked. Kiali will take whatever token is passed into the reqeuest, so as tokens
are regenerated Kiali will use the new token.
Impersonation
TokenRequest API
The authenticating reverse proxy should use the TokenRequest API instead of static
ServiceAccount tokens when possible while using impersonation. The
ServiceAccount that can impersonate users and groups is privileged and having it
be short lived cuts down on the possibility of a token being leaked while it’s being
passed between different parts of the infrastructure.
The authenticating proxy MUST drop any headers it receives from a remote client
that match the impersonation headers. Not only do you want to make sure that the
authenticating proxy can’t be overriden on which user to authenticate, but also
what groups they’re a member of.
1.3 - OpenID Connect strategy
Access Kiali requiring authentication through a third-party OpenID Connect provider.
Introduction
The openid authentication strategy lets you integrate Kiali to an external
identity provider that implements OpenID Connect, and allows
users to login to Kiali using their existing accounts of a
third-party system.
If your
Kubernetes cluster is also integrated with your OpenId provider,
then Kiali’s openid strategy can offer
namespace access control.
Kiali only supports the authorization code flow of the OpenId Connect spec.
Requirements
The Kiali’s signing key needs to be 16, 24
or 32 byte long. If you install Kiali via the operator and don’t set a custom
signing key, the operator should create a 16 byte long signing key.
If you don’t need namespace access control support, you can use any
working OpenId Server where Kiali can be configured as a client application.
If you do need namespace access control support, you need either:
The first option is preferred if you can manipulate your cluster API server
startup flags, which will result in your cluster to also be integrated with the
external OpenID provider.
The second option is provided for cases where you are using a managed
Kubernetes and your cloud provider does not support configuring OpenID
integration. Kiali assumes an implementation of a Kubernetes API server. For
example, a community user has reported to successfully configure Kiali’s OpenID
strategy by using
kube-oidc-proxy which is a
reverse proxy that handles the OpenID authentication and forwards the
authenticated requests to the Kubernetes API.
Set-up with namespace access control support
Assuming you already have a working Kubernetes cluster with OpenId integration
(or a working alternative like kube-oidc-proxy), you should already had
configured an application or a client in your OpenId server (some cloud
providers configure this app/client automatically for you). You must re-use
this existing application/client by adding the root path of your Kiali
instance as an allowed/authorized callback URL. If the OpenID server provided
you a client secret for the application/client, or if you had manually set a
client secret, issue the following command to create a Kubernetes secret
holding the OpenId client secret:
kubectl create secret generic kiali --from-literal="oidc-secret=$CLIENT_SECRET" -n $NAMESPACE
where $NAMESPACE is the namespace where you installed Kiali and
$CLIENT_SECRET is the secret you configured or provided by your OpenId
Server. If Kiali is already running, you may need to restart the Kiali pod so
that the secret is mounted in Kiali.
It’s worth emphasizing that to configure OpenID
integration you must re-use the OpenID application/client that you created for
your Kubernetes cluster. If you create a new application/client for Kiali in
your OpenId server, Kiali will fail to properly authenticate users.
Then, to enable the OpenID Connect strategy, the minimal configuration you need to
set in the Kiali CR is like the following:
spec:
  auth:
    strategy: openid
    openid:
      client_id: "kiali-client"
      issuer_uri: "https://openid.issuer.com"
This assumes that your Kubernetes cluster is configured with OpenID Connect
integration. In this case, the client-id and issuer_uri attributes must
match the --oidc-client-id and --oidc-issuer-url flags
used to start the cluster API server.
If these values don’t match, users will fail to login to Kiali.
If you are using a replacement or a reverse proxy for the Kubernetes API
server, the minimal configuration is like the following:
spec:
  auth:
    strategy: openid
    openid:
      api_proxy: "https://proxy.domain.com:port"
      api_proxy_ca_data: "..."
      client_id: "kiali-client"
      issuer_uri: "https://openid.issuer.com"
The value of client-id and issuer_uri must match the values of the
configuration of your reverse proxy or cluster API replacement. The api_proxy
attribute is the URI of the reverse proxy or cluster API replacement (only
HTTPS is allowed). The api_proxy_ca_data is the public certificate authority
file encoded in a base64 string, to trust the secure connection.
Set-up with no namespace access control support
Register Kiali as a client application in your OpenId Server. Use the root path
of your Kiali instance as the callback URL. If the OpenId Server provides you a
client secret, or if you manually set a client secret, issue the following
command to create a Kubernetes secret holding the OpenId client secret:
kubectl create secret generic kiali --from-literal="oidc-secret=$CLIENT_SECRET" -n $NAMESPACE
where $NAMESPACE is the namespace where you installed Kiali and
$CLIENT_SECRET is the secret you configured or provided by your OpenId
Server. If Kiali is already running, you may need to restart the Kiali pod so
that the secret is mounted in Kiali.
Then, to enable the OpenID Connect strategy, the minimal configuration you need
to set in the Kiali CR is like the following:
spec:
  auth:
    strategy: openid
    openid:
      client_id: "kiali-client"
      disable_rbac: true
      issuer_uri: "https://openid.issuer.com"
As namespace access control is disabled, all users logging into Kiali
will share the same cluster-wide privileges.
Additional configurations
Configuring the displayed user name
The Kiali front-end will, by default, retrieve the string of the sub claim of
the OpenID token and display it as the user name. You can customize which field
to display as the user name by setting the username_claim attribute of the
Kiali CR. For example:
spec:
  auth:
    openid:
      username_claim: "email"
If you enabled namespace access control, you will want the username_claim
attribute to match the --oidc-username-claim flag used to start the
Kubernetes API server, or the equivalent option if you are using a replacement
or reverse proxy of the API server. Else, any user-friendly claim will be OK as
it is purely informational.
By default, Kiali will request access to the openid, profile and email
standard scopes. If you need a different set of scopes, you can set the
scopes attribute in the Kiali CR. For example:
spec:
  auth:
    openid:
      scopes:
      - "openid"
      - "email"
      - "groups"
The openid scope is forced. If you don’t add it to the list of scopes to
request, Kiali will still request it from the identity provider.
Configuring authentication timeout
When the user is redirected to the external authentication system, by default
Kiali will wait at most 5 minutes for the user to authenticate. After that time
has elapsed, Kiali will reject authentication. You can adjust this timeout by
setting the authentication_timeout with the number of seconds that Kiali
should wait at most. For example:
spec:
  auth:
    openid:
      authentication_timeout: 60 # Wait only one minute.
Configuring allowed domains
Some identity providers use a shared login and regardless of configuring your
own application under your domain (or organization account), login can succeed
even if the user that is logging in does not belong to your account or
organization. Google is an example of this kind of provider.
To prevent foreign users from logging into your Kiali instance, you can
configure a list of allowed domains:
spec:
  auth:
    openid:
      allowed_domains:
      - example.com
      - foo.com
The e-mail reported by the identity provider is used for the validation. Login
will be allowed if the domain part of the e-mail is listed as an allowed
domain; else, the user will be rejected. Naturally, you will need to
configure the email scope to be requested.
There is a special case: some identity providers include a hd claim in the
id_token. If this claim is present, this is used instead of extracting the
domain from the user e-mail. For example, Google Workspace (aka G Suite)
includes this hd claim for hosted
domains.
Using an OpenID provider with a self-signed certificate
If your OpenID provider is using a self-signed certificate, you can disable
certificate validation by setting the insecure_skip_verify_tls to true in
the Kiali CR:
spec:
  auth:
    openid:
      insecure_skip_verify_tls: true
You should use self-signed certificates only for
testing purposes.
However, if your organization or internal network has an internal trusted
certificate authority (CA), and your OpenID server is using a certificate
issued by this CA, you can configure Kiali to trust certificates from this CA,
rather than disabling verification. For this, create a ConfigMap named
kiali-cabundle containing the root CA certificate (the public component)
under the openid-server-ca.crt key:
apiVersion: v1
kind: ConfigMap
metadata:
  name: kiali-cabundle
  namespace: istio-system # This is Kiali's install namespace
data:
  openid-server-ca.crt: <the public component of your CA root certificate encoded in base64>
After restarting the Kiali pod, Kiali will trust this root certificate for all
HTTPS requests related to OpenID authentication.
Using an HTTP/HTTPS Proxy
In some network configurations, there is the need to use proxies to connect to
the outside world. OpenID requires outside world connections to get metadata and
do key validation, so you can configure it by setting the http_proxy and
https_proxy keys in the Kiali CR. They use the same format as the HTTP_PROXY
and HTTPS_PROXY environment variables.
spec:
  auth:
    openid:
      http_proxy: http://USERNAME:PASSWORD@10.0.1.1:8080/
      https_proxy: https://USERNAME:PASSWORD@10.0.0.1:8080/
Passing additional options to the identity provider
When users click on the Login button on Kiali, a redirection occurs to the
authentication page of the external identity provider. Kiali sends a fixed set
of parameters to the identity provider to enable authentication. If you need to
add an additional set of parameters to your identity provider, you can use the
additional_request_params setting of the Kiali CR, which accepts key-value
pairs. For example:
spec:
  auth:
    openid:
      additional_request_params:
        prompt: login
The prompt parameter is a
standard OpenID parameter.
When the login value is passed in this parameter, the
identity provider is instructed to ask for user credentials regardless if the
user already has an active session because of a previous login in some other
system.
If your OpenId provider supports other non-standard parameters, you can specify
the ones you need in this additional_request_params setting.
Take into account that you should not add the client_id, response_type,
redirect_uri, scope, nonce nor state parameters to this list. These are
already in use by Kiali and some already have a dedicated setting.
Provider-specific instructions
Using with Keycloak
When using OpenId with Keycloak, you will need to enable the Standard Flow Enabled
option on the Client (in the Administration Console):
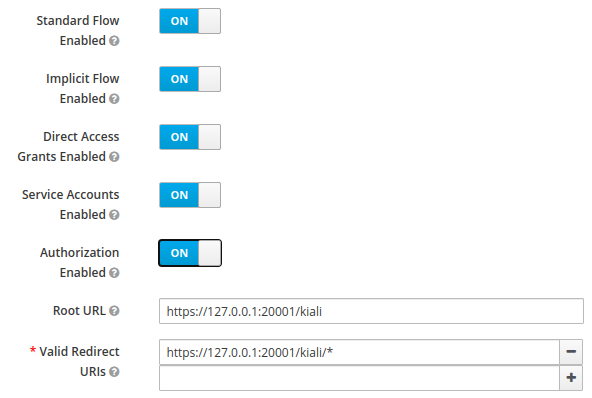
The Standard Flow described on the options is the same as the authorization
code flow from the rest of the documentation.
If you are using Google Cloud Platform (GCP) and its products such as
Google Kubernetes Engine (GKE), it should be straightforward to configure Kiali’s OpenID
strategy to authenticate using your Google credentials.
First, you’ll need to go to your GCP Project and to the Credentials screen which
is available at (Menu Icon) > APIs & Services > Credentials.
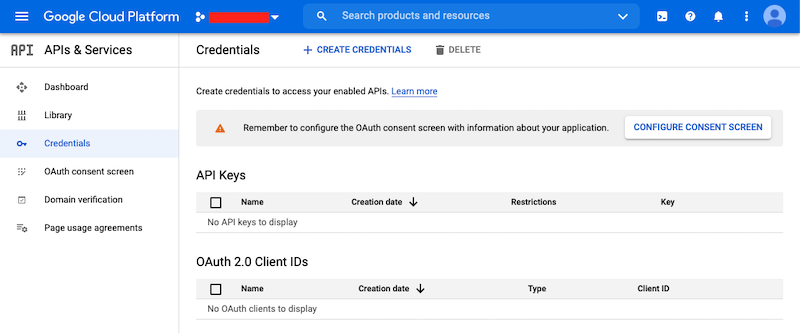
On the Credentials screen you can select to create a new OAuth client ID.
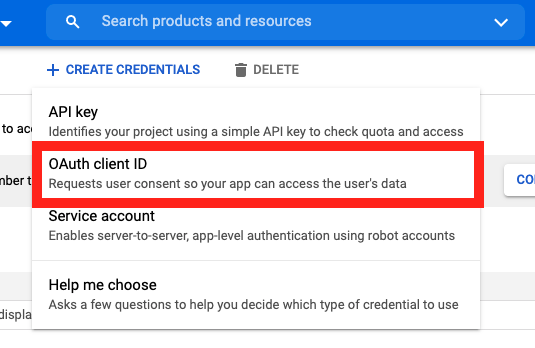
If you’ve never setup the OAuth consent screen you will need to
do that before you can create an OAuth client ID. On screen you’ll have multiple
warnings and prompts to walk you through this.
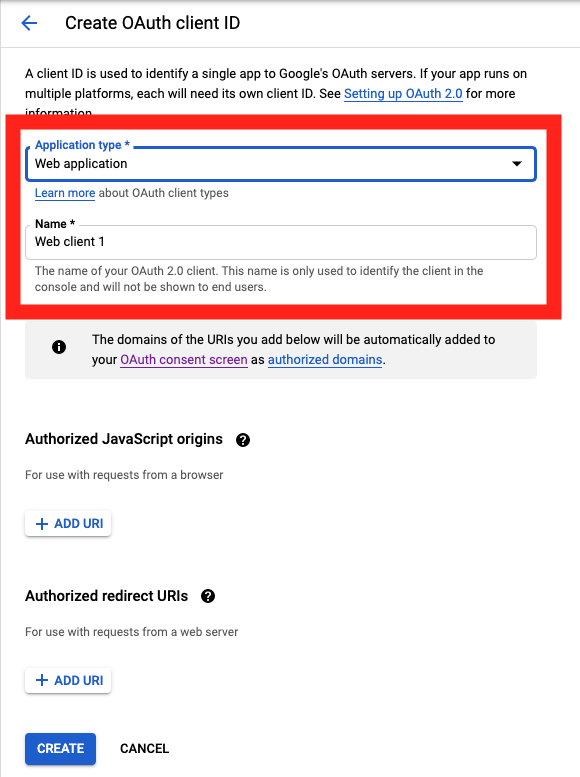
On the Create OAuth client ID screen, set the Application type to Web Application
and enter a name for your key.
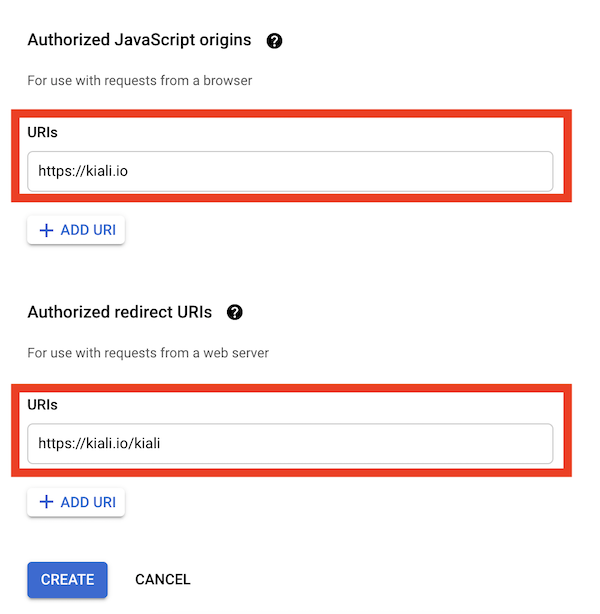
Then enter in the Authorized Javascript origins and Authorized redirect URIs for your project.
You can enter in localhost as appropriate during testing. You can also enter multiple URIs as appropriate.
After clicking Create you’ll be shown your newly minted client id and secret. These are important
and needed for your Kiali CR yaml and Kiali secrets files.
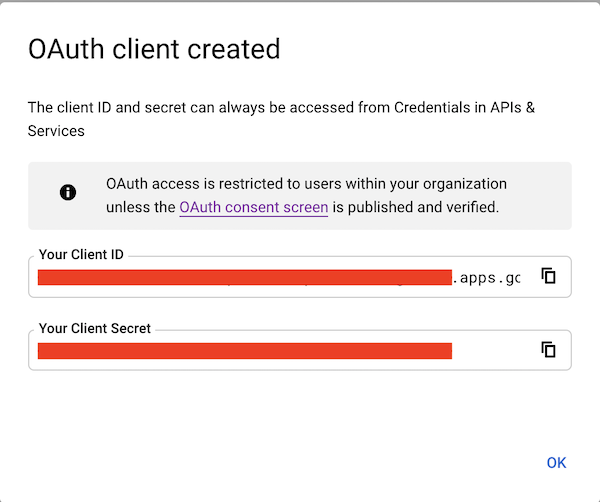
You’ll need to update your Kiali CR file to include the following auth block.
spec:
  auth:
    strategy: "openid"
    openid:
      client_id: "<your client id from GCP>"
      disable_rbac: true
      issuer_uri: "https://accounts.google.com"
      scopes: ["openid", "email"]
      username_claim: "email"
Don’t get creative here. The issuer_uri should be https://accounts.google.com.
Finally you will need to create a secret, if you don’t have one already, that sets the oidc-secret for the openid flow.
apiVersion: v1
kind: Secret
metadata:
  name: kiali
  namespace: istio-system
  labels:
    app: kiali
type: Opaque
data:
  oidc-secret: "<base64 encode your client secret from GCP and enter here>"
Once all these settings are complete just set your Kiali CR and the Kiali secret to your cluster. You may need to
refresh your Kiali Pod to set the Secret if you add the Secret after the Kiali pod is created.
Using with Azure: AKS and AAD
The OpenID authentication strategy can be used
with Azure Kubernetes Service (AKS) and Azure Active Directory (AAD) with Kiali
versions 1.33 and later. Prior Kiali versions do not support namespace access control on Azure.
AKS has support for a feature named AKS-managed Azure Active Directory, which
enables integration between AKS and AAD. This has the advantage that users can
use their AAD credentials to access AKS clusters and can also use Kubernetes
RBAC features to assign privileges to AAD users.
However, Azure is implementing this integration via the
Kubernetes Webhook Token Authentication
rather than via the Kubernetes OpenID Connect Tokens authentication
(see the Azure AD integration section in AKS Concepts documentation).
Because of this difference, authentication in AKS behaves slightly different from a standard
OpenID setup, but Kiali’s OpenID authentication strategy can still be used with
namespace access control support by following the next steps.
First, enable the AAD integration on your AKS cluster. See the
official AKS documentation to learn how.
Once it is enabled, your AKS panel should show the following:
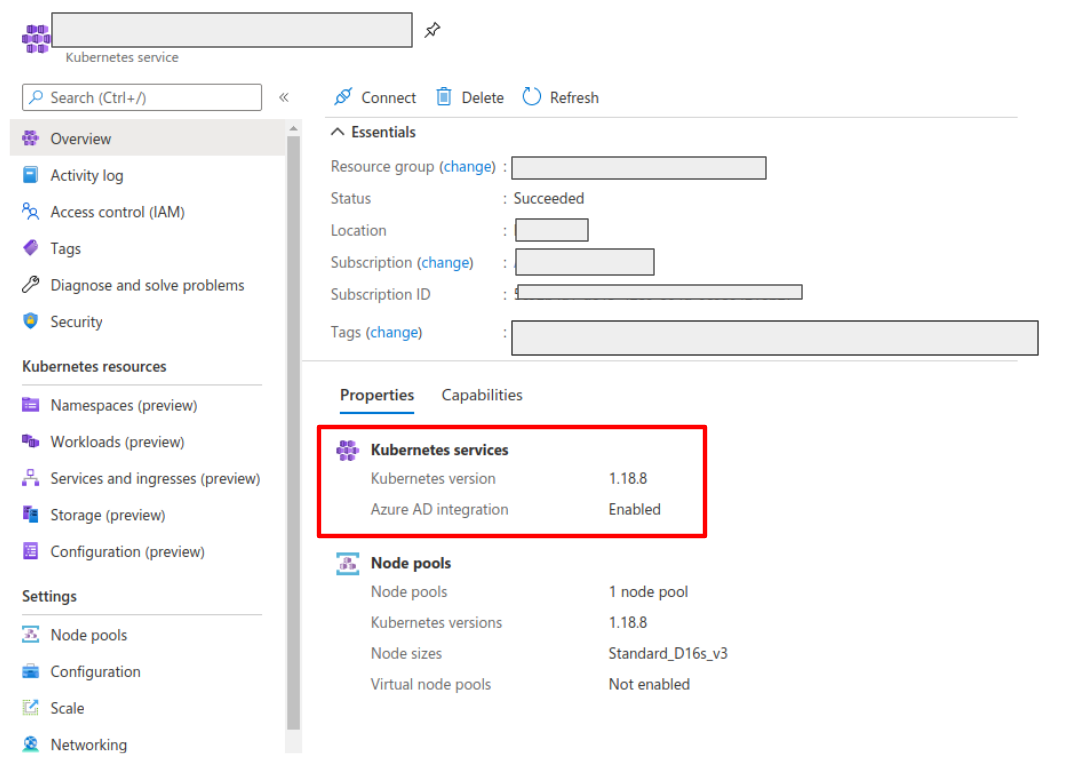
Create a web application for Kiali in your Azure AD panel:
- Go to AAD > App Registration, create an application with a redirect url like
\https://<your-kiali-url>
- Go to Certificates & secrets and create a client secret.
- After creating the client secret, take note of the provided secret. Create a
Kubernetes secret in your cluster as mentioned in the Set-up
with namespace access control support section. Please, note that the suggested name for the
Kubernetes Secret is
kiali. If you want to customize the secret name, you
will have to specify your custom name in the Kiali CR. See: secret_name in Kial CR Reference.
- Go to API Permissions and press the Add a permission button. In the new page that appears, switch to the
APIs my organization uses tab.
- Type the following ID in the search field:
6dae42f8-4368-4678-94ff-3960e28e3630 (this is a shared ID for all Azure
clusters). And select the resulting entry.
- Select the Delegated permissions square.
- Select the
user.read permission.
- Go to Authentication and make sure that the Access tokens checkbox is ticked.

Then, create or modify your Kiali CR and include the following settings:
spec:
  auth:
    strategy: "openid"
    openid:
      client_id: "<your Kiali application client id from Azure>"
      issuer_uri: "https://sts.windows.net/<your AAD tenant id>/"
      username_claim: preferred_username
      api_token: access_token
      additional_request_params:
        resource: "6dae42f8-4368-4678-94ff-3960e28e3630"
You can find your client_id and tenant_id in the Overview page of the Kiali
App registration that you just created. See this documentation for more information.
1.4 - OpenShift strategy
Access Kiali requiring OpenShift authentication.
Introduction
The openshift authentication strategy is the preferred and default strategy
when Kiali is deployed on an OpenShift cluster.
When using the openshift strategy, a user logging into Kiali will be
redirected to the login page of the OpenShift console. Once the user provides
his OpenShift credentials, he will be redireted back to Kiali and will be
logged in if the user has enough privileges.
The openshift strategy supports namespace access control.
Set-up
Since openshift is the default strategy when deploying Kiali in OpenShift,
you shouldn’t need to configure anything. If you want to be verbose, use the
following configuration in the Kiali CR:
spec:
  auth:
    strategy: openshift
The Kiali operator will make sure to setup the needed OpenShift OAuth resources to register
Kiali as a client for the most common use-cases. The openshift strategy does have a few
configuration settings that most people will never need but are available in case you have
a situation where the customization is needed. See the Kiali CR Reference page for the
documentation on those settings.
1.5 - Token strategy
Access Kiali requiring a Kubernetes ServiceAccount token.
Introduction
The token authentication strategy allows a user to login to Kiali using the
token of a Kubernetes ServiceAccount. This is similar to the
login view of Kubernetes Dashboard.
The token strategy supports namespace access control.
Set-up
Since token is the default strategy when deploying Kiali in Kubernetes, you
shouldn’t need to configure anything, unless your cluster is OpenShift. If you
want to be verbose or if you need to enable the token strategy in OpenShift,
use the following configuration in the Kiali CR:
spec:
  auth:
    strategy: token
The token strategy doesn’t have any additional configuration other than the
session expiration time.
1.6 - Session options
Session timeout and signing key configuration
There are two settings that are available for the user’s session. The first one
is the session expiration time, which is only applicable to
token and header
authentication strategies:
spec:
  login_token:
    # By default, users session expires in 24 hours.
    expiration_seconds: 86400
The session expiration time is the amount of time before the user is asked to
extend his session by another cycle. It does not matter if the user is actively
using Kiali, the user will be asked if the session should be extended.
The second available option is the signing key configuration, which is unset by
default, meaning that a random 16-character signing key will be generated
and stored to a secret named kiali-signing-key, in Kiali’s installation
namespace:
spec:
  login_token:
    # By default, create a random signing key and store it in
    # a secret named "kiali-signing-key".
    signing_key: ""
If the secret already exists (which may mean a previous Kiali installation was
present), then the secret is reused.
The signing key is used on security sensitive data. For example, one of the
usages is to sign HTTP cookies related to the user session to prevent session
forgery.
If you need to set a custom fixed key, you can pre-create or modify the
kiali-signing-key secret:
apiVersion: v1
kind: Secret
metadata:
  namespace: "kiali-installation-namespace"
  name: kiali-signing-key
type: Opaque
data:
  key: "<your signing key encoded in base64>"
The signing key must be 16, 24 or 32 bytes length. Otherwise, Kiali will fail to start.
If you prefer a different secret name for the signing key and/or a different
key-value pair of the secret, you can specify your preferred names in the Kiali
CR:
spec:
  login_token:
    signing_key: "secret:<secretName>:<secretDataKey>"
It is possible to specify the signing key directly in the Kiali CR, in the
spec.login_token.signing_key attribute. However, this should be only for
testing purposes. The signing key is sensitive and should be treated like a
password that must be protected.
2 - Console Customization
Default selections, find and hide presets and custom metric aggregations.
Custom metric aggregations
The inbound and outbound metric pages, in the Metrics settings drop-down,
provides an opinionated set of groupings that work both for filtering out
metric data that does not match the selection and for aggregating data into
series. Each option is backed by a label on the collected Istio telemetry.
It is possible to add custom aggregations, like in the following example:
spec:
  kiali_feature_flags:
    ui_defaults:
      metrics_inbound:
        aggregations:
        - display_name: Istio Network
          label: topology_istio_io_network
        - display_name: Istio Revision
          label: istio_io_rev
      metrics_outbound:
        aggregations:
        - display_name: Istio Revision
          label: istio_io_rev
Notice that custom aggregations for inbound and outbound metrics are defined separately.
You can find some screenshots in Kiali v1.40 feature update blog
post.
Default metrics duration and refresh interval
Most Kiali pages show metrics per refresh and refresh interval
drop-downs. These are located at the top-right of the page.
Metrics per refresh specifies the time range back from the current
instant to fetch metrics and/or distributed tracing data. By default, a
1-minute time range is selected.
Refresh interval specifies how often Kiali will automatically refresh the
data shown. By default, Kiali refreshes data every 15 seconds.
spec:
  kiali_feature_flags:
    ui_defaults:
      # Valid values: 1m, 5m, 10m, 30m, 1h, 3h, 6h, 12h, 1d, 7d, 30d
      metrics_per_refresh: "1m"

      # Valid values: pause, 10s, 15s, 30s, 1m, 5m, 15m
      refresh_interval: "15s"
User selections won’t persist a reload.
Default namespace selection
By default, when Kiali is accessed by the first time, on most Kiali pages users
will need to use the namespace drop-down to choose namespaces they want to view
data from. The selection will be persisted on reloads.
However, it is possible to configure a predefined selection of
namespaces, like in the following example:
spec:
  kiali_feature_flags:
    ui_defaults:
      namespaces:
      - istio-system
      - bookinfo
Namespace selection will reset to the predefined set on reloads. Also, if for
some reason a namespace becomes deleted, Kiali will simply ignore it from the
list.
Graph find and hide presets
In the toolbar of the topology graph, the Find and Hide textboxes can be
configured with presets for your most used criteria. You can find screenshots
and a brief description of this feature in the feature update blog post for
versions 1.31 to 1.33.
The following are the default presets:
spec:
  kiali_feature_flags:
    ui_defaults:
      graph:
        find_options:
        - auto_select: false
          description: "Find: slow edges (> 1s)"
          expression: "rt > 1000"
        - auto_select: false
          description: "Find: unhealthy nodes"
          expression:  "! healthy"
        - auto_select: false
          description: "Find: unknown nodes"
          expression:  "name = unknown"
        hide_options:
        - auto_select: false
          description: "Hide: healthy nodes"
          expression: "healthy"
        - auto_select: false
          description: "Hide: unknown nodes"
          expression:  "name = unknown"
Hopefully, the attributes to configure this feature are self-explanatory.
To enable one of the configurations by default, it is possible to set auto_select to true, available for find and hide settings.
Note that by providing your own presets, you will be overriding the default
configuration. Make sure to include any default presets that you need in case
you provide your own configuration.
Graph default traffic rates
Traffic rates in the graph are fetched from Istio telemetry and there are
several metric sources
that can be used.
In the graph page, you can select the traffic rate metrics using the Traffic
drop-down (next to the Namespaces drop-down). By default, Requests is
selected for GRPC and HTTP protocols, and Sent bytes is selected for the TCP
protocol, but you can change the default selection:
spec:
  kiali_feature_flags:
    ui_defaults:
      graph:
        traffic:
          grpc: "requests" # Valid values: none, requests, sent, received and total
          http: "requests" # Valid values: none and requests
          tcp:  "sent"     # Valid values: none, sent, received and total
Note that only requests provide response codes and will allow health to be
calculated. Also, the resulting topology graph may be different for each source.
3 - Custom Dashboards
Configuring additional, non-default dashboards.
Custom Dashboards require some configuration to work properly.
Declaring a custom dashboard
When installing Kiali, you define your own custom dashboards in the Kiali CR spec.custom_dashboards field. Here’s an example of what it looks like:
custom_dashboards:
- name: vertx-custom
  title: Vert.x Metrics
  runtime: Vert.x
  discoverOn: "vertx_http_server_connections"
  items:
  - chart:
      name: "Server response time"
      unit: "seconds"
      spans: 6
      metrics:
      - metricName: "vertx_http_server_responseTime_seconds"
        displayName: "Server response time"
      dataType: "histogram"
      aggregations:
      - label: "path"
        displayName: "Path"
      - label: "method"
        displayName: "Method"
  - chart:
      name: "Server active connections"
      unit: ""
      spans: 6
      metricName: "vertx_http_server_connections"
      dataType: "raw"
  - include: "micrometer-1.1-jvm"
  externalLinks:
  - name: "My custom Grafana dashboard"
    type: "grafana"
    variables:
      app: var-app
      namespace: var-namespace
      version: var-version
The name field corresponds to what you can set in the pod annotation kiali.io/dashboards.
The rest of the field definitions are:
- runtime: optional, name of the related runtime. It will be displayed on the corresponding Workload Details page. If omitted no name is displayed.
- title: dashboard title, displayed as a tab in Application or Workloads Details
- discoverOn: metric name to match for auto-discovery. If omitted, the dashboard won’t be discovered automatically, but can still be used via pods annotation.
- items: a list of items, that can be either chart, to define a new chart, or include to reference another dashboard
- chart: new chart object
- name: name of the chart
- chartType: type of the chart, can be one of line (default), area, bar or scatter
- unit: unit for Y-axis. Free-text field to provide any unit suffix. It can eventually be scaled on display. See specific section below.
- unitScale: in case the unit needs to be scaled by some factor, set that factor here. For instance, if your data is in milliseconds, set
0.001 as scale and seconds as unit.
- spans: number of “spans” taken by the chart, from 1 to 12, using bootstrap convention
- metrics: a list of metrics to display on this single chart:
- metricName: the metric name in Prometheus
- displayName: name to display on chart
- dataType: type of data to be displayed in the chart. Can be one of raw, rate or histogram. Raw data will be queried without transformation. Rate data will be queried using
promQL rate() function. And histogram with histogram_quantile() function.
- min and max: domain for Y-values. When unset, charts implementations should usually automatically adapt the domain with the displayed data.
- xAxis: type of the X-axis, can be one of time (default) or series. When set to series, only one datapoint per series will be displayed, and the chart type then defaults to bar.
- aggregator: defines how the time-series are aggregated when several are returned for a given metric and label set. For example, if a Deployment creates a ReplicaSet of several Pods, you will have at least one time-series per Pod. Since Kiali shows the dashboards at the workload (ReplicaSet) level or at the application level, they will have to be aggregated. This field can be used to fix the aggregator, with values such as sum or avg (full list available in Prometheus documentation). However, if omitted the aggregator will default to sum and can be changed from the dashboard UI.
- aggregations: list of labels eligible for aggregations / groupings (they will be displayed in Kiali through a dropdown list)
- label: Prometheus label name
- displayName: name to display in Kiali
- singleSelection: boolean flag to switch between single-selection and multi-selection modes on the values of this label. Defaults to false.
- groupLabels: a list of Prometheus labels to be used for grouping. Similar to aggregations, except this grouping will be always turned on.
- sortLabel: Prometheus label to be used for the metrics display order.
- sortLabelParseAs: set to int if sortLabel needs to be parsed and compared as an integer instead of string.
- include: to include another dashboard, or a specific chart from another dashboard. Typically used to compose with generic dashboards such as the ones about MicroProfile Metrics or Micrometer-based JVM metrics. To reference a full dashboard, set the name of that dashboard. To reference a specific chart of another dashboard, set the name of the dashboard followed by
$ and the name of the chart (ex: include: "microprofile-1.1$Thread count").
- externalLinks: a list of related external links (e.g. to Grafana dashboards)
- name: name of the related dashboard in the external system (e.g. name of a Grafana dashboard)
- type: link type, currently only grafana is allowed
- variables: a set of variables that can be injected in the URL. For instance, with something like namespace: var-namespace and app: var-app, an URL to a Grafana dashboard that manages namespace and app variables would look like:
http://grafana-server:3000/d/xyz/my-grafana-dashboard?var-namespace=some-namespace&var-app=some-app. The available variables in this context are namespace, app and version.
Label clash: you should try to avoid labels clashes within a dashboard.
In Kiali, labels for grouping are aggregated in the top toolbar, so if the same label refers to different things depending on the metric, you wouldn’t be able to distinguish them in the UI. For that reason, ideally, labels should not have too generic names in Prometheus.
For instance labels named “id” for both memory spaces and buffer pools would better be named “space_id” and “pool_id”. If you have control on label names, it’s an important aspect to take into consideration.
Else, it is up to you to organize dashboards with that in mind, eventually splitting them into smaller ones to resolve clashes.
Modifying Built-in Dashboards: If you want to modify or remove a built-in dashboard, you can set its new definition in the Kiali CR’s spec.custom_dashboards. Simply define a custom dashboard with the same name as the built-in dashboard. To remove a built-in dashboard so Kiali doesn’t use it, simply define a custom dashboard by defining only its name with no other data associated with it (e.g. in spec.custom_dashboards you add a list item that has - name: <name of built-in dashboard to remove>.
Dashboard scope
The custom dashboards defined in the Kiali CR are available for all workloads in all namespaces.
Additionally, new custom dashboards can be created for a given namespace or workload, using the dashboards.kiali.io/templates annotation.
This is an example where a “Custom Envoy” dashboard will be available for all applications and workloads for the default namespace:
apiVersion: v1
kind: Namespace
metadata:
  name: default
  annotations:
    dashboards.kiali.io/templates: |
      - name: custom_envoy
        title: Custom Envoy
        discoverOn: "envoy_server_uptime"
        items:
          - chart:
              name: "Pods uptime"
              spans: 12
              metricName: "envoy_server_uptime"
              dataType: "raw"
This other example will create an additional “Active Listeners” dashboard only on details-v1 workload:
apiVersion: apps/v1
kind: Deployment
metadata:
  name: details-v1
  labels:
    app: details
    version: v1
spec:
  replicas: 1
  selector:
    matchLabels:
      app: details
      version: v1
  template:
    metadata:
      labels:
        app: details
        version: v1
      annotations:
        dashboards.kiali.io/templates: |
          - name: envoy_listeners
            title: Active Listeners
            discoverOn: "envoy_listener_manager_total_listeners_active"
            items:
              - chart:
                  name: "Total Listeners"
                  spans: 12
                  metricName: "envoy_listener_manager_total_listeners_active"
                  dataType: "raw"
    spec:
      serviceAccountName: bookinfo-details
      containers:
      - name: details
        image: docker.io/istio/examples-bookinfo-details-v1:1.16.2
        imagePullPolicy: IfNotPresent
        ports:
        - containerPort: 9080
        securityContext:
          runAsUser: 1000
Units
Some units are recognized in Kiali and scaled appropriately when displayed on charts:
unit: "seconds" can be scaled down to ms, µs, etc.unit: "bytes-si" and unit: "bitrate-si" can be scaled up to kB, MB (etc.) using SI / metric system. The aliases unit: "bytes" and unit: "bitrate" can be used instead.unit: "bytes-iec" and unit: "bitrate-iec" can be scaled up to KiB, MiB (etc.) using IEC standard / IEEE 1541-2002 (scale by powers of 2).
Other units will fall into the default case and be scaled using SI standard. For instance, unit: "m" for meter can be scaled up to km.
Prometheus Configuration
Kiali custom dashboards work exclusively with Prometheus, so it must be configured correctly to pull your application metrics.
If you are using the demo Istio installation with addons, your Prometheus instance should already be correctly configured and you can skip to the next section; with the exception of Istio 1.6.x where
you need customize the ConfigMap, or install Istio with the flag --set meshConfig.enablePrometheusMerge=true.
Using another Prometheus instance
You can use a different instance of Prometheus for these metrics, as opposed to Istio metrics. This second Prometheus instance can be configured from the Kiali CR when using the Kiali operator, or ConfigMap otherwise:
# ...
external_services:
  custom_dashboards:
    prometheus:
      url: URL_TO_PROMETHEUS_SERVER_FOR_CUSTOM_DASHBOARDS
    namespace_label: kubernetes_namespace
  prometheus:
    url: URL_TO_PROMETHEUS_SERVER_FOR_ISTIO_METRICS
# ...
For more details on this configuration, such as Prometheus authentication options, check the Kiali CR Reference page.
You must make sure that this Prometheus instance is correctly configured to scrape your application pods and generates labels that Kiali will understand. Please refer to
this documentation to setup the kubernetes_sd_config section. As a reference,
here is how it is configured in Istio.
It is important to preserve label mapping, so that Kiali can filter by app and version, and to have the same namespace label as defined per Kiali config. Here’s a relabel_configs that allows this:
      relabel_configs:
      - action: labelmap
        regex: __meta_kubernetes_pod_label_(.+)
      - source_labels: [__meta_kubernetes_namespace]
        action: replace
        target_label: kubernetes_namespace
Pod Annotations and Auto-discovery
Application pods must be annotated for the Prometheus scraper, for example, within a Deployment definition:
spec:
  template:
    metadata:
      annotations:
        prometheus.io/scrape: "true"
        prometheus.io/port: "8080"
        prometheus.io/path: "/metrics"
- prometheus.io/scrape tells Prometheus to fetch these metrics or not
- prometheus.io/port is the port under which metrics are exposed
- prometheus.io/path is the endpoint path where metrics are exposed, default is /metrics
Kiali will try to discover automatically dashboards that are relevant for a given Application or Workload. To do so, it reads their metrics and try to match them with the discoverOn field defined on dashboards.
But if you can’t rely on automatic discovery, you can explicitly annotate the pods to associate them with Kiali dashboards.
spec:
  template:
    metadata:
      annotations:
        # (prometheus annotations...)
        kiali.io/dashboards: vertx-server
kiali.io/dashboards is a comma-separated list of dashboard names that Kiali will look for. Each name in the list must match the name of a built-in dashboard or the name of a custom dashboard as defined in the Kial CR’s spec.custom_dashboards.
4 - Istio Environment
Labels and resource names
Istio recommends adding app and version labels to
pods to attach this information to telemetry. Kiali relies on correctness of these labels for several features.
In Istio, it is possible to use a different set of labels, like
app.kubernetes.io/name and app.kubernetes.io/version, however you must
configure Kiali to the labels you are using. By default, Kiali uses Istio’s
recommended labels:
spec:
  istio_labels:
    app_label_name: "app"
    version_label_name: "version"
Although Istio lets you use different labels on different pods, Kiali can only
use a single set.
For example, Istio lets you use the app label in one pod and the
app.kubernetes.io/name in another pod and it will generate telemetry
correctly. However, you will have no way to configure Kiali for this case.
Monitoring port of the IstioD pod
Kiali connects directly to the IstioD pod (not the Service) to check for its
health. By default, the connection is done to port 15014 which is the default
monitoring port of the IstioD pod.
Under some circumstances, you may need to change the monitoring port of the
IstioD pod to something else. For example, when running IstioD in host
network mode
the network is shared between several pods, requiring to change listening ports
of some pods to prevent conflicts.
It is possible to map the newly chosen monitoring port of the IstioD pod in the
related Service to let other services continue working normally. However, since
Kiali connects directly to the IstioD pod, you need to configure the assigned
monitoring port in the Kiali CR:
spec:
  external_services:
    istio:
      istiod_pod_monitoring_port: 15014
Root namespace
Istio’s root namespace is the namespace where you can create some resources
to define default Istio configurations and adapt Istio behavior to your
environment. For more information on this Istio configuration, check the Istio
docs Global Mesh options
page and
search for “rootNamespace”.
Kiali uses the root namespace for some of the validations of Istio resources.
If you customized the Istio root namespace, you will need to replicate that
configuration in Kiali. By default, it is unset:
spec:
  external_services:
    istio:
      root_namespace: ""
Sidecar injection, canary upgrade management and Istio revisions
Kiali can assist into configuring automatic sidecar injection, and also can
assist when you are migrating workloads from an old Istio version to a newer
one using the canary upgrade
method. Kiali uses the
standard Istio labels to control sidecar injection
policy
and canary upgrades.
Management of sidecar injection is enabled by default. If you don’t want this
feature, you can disable it with the following configuration:
spec:
  kiali_feature_flags:
    istio_injection_action: false
Assistance for migrating workloads between Istio revisions when doing a canary
upgrade is turned off by default. This is because it is required to know what
is the revision name that was used when
installing
each Istio control plane. You can enable and configure the canary upgrade
support with the following configuration:
spec:
  external_services:
    istio:
      istio_canary_revision:
        # Revision string of old Istio version
        current: "1-10-3"
        # Revision string of new Istio version
        upgrade: "1-11-0"
  kiali_feature_flags:
    # Turns on canary upgrade support
    istio_upgrade_action: true
Please note that Kiali will use revision labels to control sidecar injection
policy only when canary upgrade support is enabled; else, non-revision labels
are used. Make sure you finish the canary upgrade before turning off the canary
upgrade support. If you need to disable Kiali’s canary upgrade feature while an
upgrade is unfinished, it will be safer if you also disable the sidecar
injection management feature.
It is important to note that canary upgrades require adding a revision name
during the installation of control planes. You will notice that the revision
name will be appended to the name of Istio resources. Thus, once/if you are
using Kiali with an Istio control plane that has a revision name you will need
to specify what is the name of a few Istio resources that Kiali uses. For
example, if your control plane has a revision name 1-11-0 you would need to
set these configurations:
spec:
  external_services:
    istio:
      config_map_name: "istio-1-11-0"
      istio_sidecar_injector_config_map_name: "istio-sidecar-injector-1-11-0"
      istiod_deployment_name: "istiod-1-11-0"
There following are links to sections of Kiali blogs posts that briefly
explains these features:
5 - Kiali CR Reference
Reference page for the Kiali CR.
The Kiali Operator will watch for resources of this type and install Kiali according to those resources' configurations.
Example CR
(all values shown here are the defaults unless otherwise noted)
apiVersion: kiali.io/v1alpha1
kind: Kiali
metadata:
  name: kiali
  annotations:
    ansible.sdk.operatorframework.io/verbosity: "1"
spec:
  additional_display_details:
  - title: "API Documentation"
    annotation: "kiali.io/api-spec"
    icon_annotation: "kiali.io/api-type"

  installation_tag: ""

  istio_namespace: ""

  version: "default"

  api:
    namespaces:
      exclude:
      - "^istio-operator"
      - "^kube-.*"
      - "^openshift.*"
      - "^ibm.*"
      - "^kiali-operator"
      include: []
      label_selector_exclude: ""
      # default: label_selector_include is undefined
      label_selector_include: "kiali.io/member-of=istio-system"
  auth:
    strategy: ""
    openid:
      # default: additional_request_params is empty
      additional_request_params:
        openIdReqParam: "openIdReqParamValue"
      # default: allowed_domains is an empty list
      allowed_domains: ["allowed.domain"]
      api_proxy: ""
      api_proxy_ca_data: ""
      api_token: "id_token"
      authentication_timeout: 300
      authorization_endpoint: ""
      client_id: ""
      disable_rbac: false
      http_proxy: ""
      https_proxy: ""
      insecure_skip_verify_tls: false
      issuer_uri: ""
      scopes: ["openid", "profile", "email"]
      username_claim: "sub"
    openshift:
      auth_timeout: 10
      client_id_prefix: "kiali"
      #token_inactivity_timeout:
      #token_max_age:

  # default: custom_dashboards is an empty list
  custom_dashboards:
  - name: "envoy"

  deployment:
    # default: accessible_namespaces is undefined
    accessible_namespaces: [ "my-mesh.*" ]
    # default: additional_service_yaml is empty
    additional_service_yaml:
      externalName: "kiali.example.com"
    affinity:
      # default: node is empty
      node:
        requiredDuringSchedulingIgnoredDuringExecution:
          nodeSelectorTerms:
          - matchExpressions:
            - key: kubernetes.io/e2e-az-name
              operator: In
              values:
              - e2e-az1
              - e2e-az2
      # default: pod is empty
      pod:
        requiredDuringSchedulingIgnoredDuringExecution:
        - labelSelector:
            matchExpressions:
            - key: security
              operator: In
              values:
              - S1
          topologyKey: topology.kubernetes.io/zone
      # default: pod_anti is empty
      pod_anti:
        preferredDuringSchedulingIgnoredDuringExecution:
        - weight: 100
          podAffinityTerm:
            labelSelector:
              matchExpressions:
              - key: security
                operator: In
                values:
                - S2
            topologyKey: topology.kubernetes.io/zone
    # default: cluster_wide_access is undefined
    cluster_wide_access: false
    # default: configmap_annotations is empty
    configmap_annotations:
      strategy.spinnaker.io/versioned: "false"
    # default: custom_secrets is an empty list
    custom_secrets:
    - name: "a-custom-secret"
      mount: "/a-custom-secret-path"
      optional: true
    hpa:
      api_version: ""
      # default: spec is empty
      spec:
        maxReplicas: 2
        minReplicas: 1
        metrics:
        - type: Resource
          resource:
            name: cpu
            target:
              type: Utilization
              averageUtilization: 50
    # default: host_aliases is an empty list
    host_aliases:
    - ip: "192.168.1.100"
      hostnames:
      - "foo.local"
      - "bar.local"
    image_digest: ""
    image_name: ""
    image_pull_policy: "IfNotPresent"
    # default: image_pull_secrets is an empty list
    image_pull_secrets: ["image.pull.secret"]
    image_version: ""
    ingress:
      # default: additional_labels is empty
      additional_labels:
        ingressAdditionalLabel: "ingressAdditionalLabelValue"
      class_name: "nginx"
      # default: enabled is undefined
      enabled: false
      # default: override_yaml is undefined
      override_yaml:
        metadata:
          annotations:
            nginx.ingress.kubernetes.io/secure-backends: "true"
            nginx.ingress.kubernetes.io/backend-protocol: "HTTPS"
        spec:
          rules:
          - http:
              paths:
              - path: "/kiali"
                pathType: Prefix
                backend:
                  service:
                    name: "kiali"
                    port:
                      number: 20001
    instance_name: "kiali"
    logger:
      log_level: "info"
      log_format: "text"
      sampler_rate: "1"
      time_field_format: "2006-01-02T15:04:05Z07:00"
    namespace: "istio-system"
    # default: node_selector is empty
    node_selector:
      nodeSelector: "nodeSelectorValue"
    # default: pod_annotations is empty
    pod_annotations:
      podAnnotation: "podAnnotationValue"
    # default: pod_labels is empty
    pod_labels:
      sidecar.istio.io/inject: "true"
    priority_class_name: ""
    replicas: 1
    # default: resources is undefined
    resources:
      requests:
        cpu: "10m"
        memory: "64Mi"
      limits:
        memory: "1Gi"
    secret_name: "kiali"
    security_context: {}
    # default: service_annotations is empty
    service_annotations:
      svcAnnotation: "svcAnnotationValue"
    # default: service_type is undefined
    service_type: "NodePort"
    # default: tolerations is an empty list
    tolerations:
    - key: "example-key"
      operator: "Exists"
      effect: "NoSchedule"
    verbose_mode: "3"
    version_label: ""
    view_only_mode: false

  external_services:
    custom_dashboards:
      discovery_auto_threshold: 10
      discovery_enabled: "auto"
      enabled: true
      is_core: false
      namespace_label: "namespace"
      prometheus:
        auth:
          ca_file: ""
          insecure_skip_verify: false
          password: ""
          token: ""
          type: "none"
          use_kiali_token: false
          username: ""
        cache_duration: 10
        cache_enabled: true
        cache_expiration: 300
        # default: custom_headers is empty
        custom_headers:
          customHeader1: "customHeader1Value"
        health_check_url: ""
        is_core: true
        # default: query_scope is empty
        query_scope:
          mesh_id: "mesh-1"
          cluster: "cluster-east"
        thanos_proxy:
          enabled: false
          retention_period: "7d"
          scrape_interval: "30s"
        url: ""
    grafana:
      auth:
        ca_file: ""
        insecure_skip_verify: false
        password: ""
        token: ""
        type: "none"
        use_kiali_token: false
        username: ""
      dashboards:
      - name: "Istio Service Dashboard"
        variables:
          namespace: "var-namespace"
          service: "var-service"
      - name: "Istio Workload Dashboard"
        variables:
          namespace: "var-namespace"
          workload: "var-workload"
      - name: "Istio Mesh Dashboard"
      - name: "Istio Control Plane Dashboard"
      - name: "Istio Performance Dashboard"
      - name: "Istio Wasm Extension Dashboard"
      enabled: true
      health_check_url: ""
      # default: in_cluster_url is undefined
      in_cluster_url: ""
      is_core: false
      url: ""
    istio:
      component_status:
        components:
        - app_label: "istiod"
          is_core: true
          is_proxy: false
        - app_label: "istio-ingressgateway"
          is_core: true
          is_proxy: true
          # default: namespace is undefined
          namespace: istio-system
        - app_label: "istio-egressgateway"
          is_core: false
          is_proxy: true
          # default: namespace is undefined
          namespace: istio-system
        enabled: true
      config_map_name: "istio"
      envoy_admin_local_port: 15000
      gateway_api_class_name: ""
      istio_api_enabled: true
      # default: istio_canary_revision is undefined
      istio_canary_revision:
        current: "1-9-9"
        upgrade: "1-10-2"
      istio_identity_domain: "svc.cluster.local"
      istio_injection_annotation: "sidecar.istio.io/inject"
      istio_sidecar_annotation: "sidecar.istio.io/status"
      istio_sidecar_injector_config_map_name: "istio-sidecar-injector"
      istiod_deployment_name: "istiod"
      istiod_pod_monitoring_port: 15014
      root_namespace: ""
      url_service_version: ""
    prometheus:
      auth:
        ca_file: ""
        insecure_skip_verify: false
        password: ""
        token: ""
        type: "none"
        use_kiali_token: false
        username: ""
      cache_duration: 10
      cache_enabled: true
      cache_expiration: 300
      # default: custom_headers is empty
      custom_headers:
        customHeader1: "customHeader1Value"
      health_check_url: ""
      is_core: true
      # default: query_scope is empty
      query_scope:
        mesh_id: "mesh-1"
        cluster: "cluster-east"
      thanos_proxy:
        enabled: false
        retention_period: "7d"
        scrape_interval: "30s"
      url: ""
    tracing:
      auth:
        ca_file: ""
        insecure_skip_verify: false
        password: ""
        token: ""
        type: "none"
        use_kiali_token: false
        username: ""
      enabled: true
      in_cluster_url: ""
      is_core: false
      namespace_selector: true
      # default: query_scope is empty
      query_scope:
        mesh_id: "mesh-1"
        cluster: "cluster-east"
      query_timeout: 5
      url: ""
      use_grpc: true
      whitelist_istio_system: ["jaeger-query", "istio-ingressgateway"]

  health_config:
    # default: rate is an empty list
    rate:
    - namespace: ".*"
      kind: ".*"
      name: ".*"
      tolerance:
      - protocol: "http"
        direction: ".*"
        code: "[1234]00"
        degraded: 5
        failure: 10

  identity:
    # default: cert_file is undefined
    cert_file: ""
    # default: private_key_file is undefined
    private_key_file: ""

  istio_labels:
    app_label_name: "app"
    injection_label_name: "istio-injection"
    injection_label_rev:  "istio.io/rev"
    version_label_name: "version"

  kiali_feature_flags:
    certificates_information_indicators:
      enabled: true
      secrets:
      - "cacerts"
      - "istio-ca-secret"
    clustering:
      autodetect_secrets:
        enabled: true
        label: "kiali.io/multiCluster=true"
      clusters: []
      kiali_urls: []
    disabled_features: []
    istio_annotation_action: true
    istio_injection_action: true
    istio_upgrade_action: false
    ui_defaults:
      graph:
        find_options:
        - description: "Find: slow edges (> 1s)"
          expression: "rt > 1000"
        - description: "Find: unhealthy nodes"
          expression:  "! healthy"
        - description: "Find: unknown nodes"
          expression:  "name = unknown"
        hide_options:
        - description: "Hide: healthy nodes"
          expression: "healthy"
        - description: "Hide: unknown nodes"
          expression:  "name = unknown"
        traffic:
          grpc: "requests"
          http: "requests"
          tcp:  "sent"
      metrics_per_refresh: "1m"
      # default: metrics_inbound is undefined
      metrics_inbound:
        aggregations:
        - display_name: "Istio Network"
          label: "topology_istio_io_network"
        - display_name: "Istio Revision"
          label: "istio_io_rev"
      # default: metrics_outbound is undefined
      metrics_outbound:
        aggregations:
        - display_name: "Istio Network"
          label: "topology_istio_io_network"
        - display_name: "Istio Revision"
          label: "istio_io_rev"
      # default: namespaces is an empty list
      namespaces: ["istio-system"]
      refresh_interval: "1m"
    validations:
      ignore: ["KIA1301"]
      skip_wildcard_gateway_hosts: false

  kubernetes_config:
    burst: 200
    cache_duration: 300
    cache_token_namespace_duration: 10
    excluded_workloads:
    - "CronJob"
    - "DeploymentConfig"
    - "Job"
    - "ReplicationController"
    qps: 175

  login_token:
    expiration_seconds: 86400
    signing_key: ""

  server:
    address: ""
    audit_log: true
    cors_allow_all: false
    gzip_enabled: true
    observability:
      metrics:
        enabled: true
        port: 9090
      tracing:
        collector_type: "jaeger"
        collector_url: "http://jaeger-collector.istio-system:14268/api/traces"
        enabled: false
        otel:
          protocol: "http"
    port: 20001
    web_fqdn: ""
    web_history_mode: ""
    web_port: ""
    web_root: ""
    web_schema: ""
Validating your Kiali CR
A Kiali tool is available to allow you to check your own Kiali CR to ensure it is valid. Simply download the validation script and run it, passing in the location of the Kiali CRD you wish to validate with (e.g. the latest version is found here) and the location of your Kiali CR. You must be connected to/logged into a cluster for this validation tool to work.
For example, to validate a Kiali CR named kiali in the namespace istio-system using the latest version of the Kiali CRD, run the following:
bash <(curl -sL https://raw.githubusercontent.com/kiali/kiali-operator/master/crd-docs/bin/validate-kiali-cr.sh) \
  -crd https://raw.githubusercontent.com/kiali/kiali-operator/master/crd-docs/crd/kiali.io_kialis.yaml \
  --kiali-cr-name kiali \
  -n istio-system
If you wish to test your Kiali CR with an older version of Kiali, replace master in the above -crd option with the version you wish to test. For example, to test your Kiali CR with Kiali version v1.53.0, pass in the option -crd https://raw.githubusercontent.com/kiali/kiali-operator/v1.53.0/crd-docs/crd/kiali.io_kialis.yaml in the above command.
For additional help in using this validation tool, pass it the --help option.
Properties
(object)
This is the CRD for the resources called Kiali CRs. The Kiali Operator will watch for resources of this type and when it detects a Kiali CR has been added, deleted, or modified, it will install, uninstall, and update the associated Kiali Server installation. The settings here will configure the Kiali Server as well as the Kiali Operator. All of these settings will be stored in the Kiali ConfigMap. Do not modify the ConfigMap; it will be managed by the Kiali Operator. Only modify the Kiali CR when you want to change a configuration setting.
(array)
A list of additional details that Kiali will look for in annotations. When found on any workload or service, Kiali will display the additional details in the respective workload or service details page. This is typically used to inject some CI metadata or documentation links into Kiali views. For example, by default, Kiali will recognize these annotations on a service or workload (e.g. a Deployment, StatefulSet, etc.):
annotations:
  kiali.io/api-spec: http://list/to/my/api/doc
  kiali.io/api-type: rest
Note that if you change this setting for your own custom annotations, keep in mind that it would override the current default. So you would have to add the default setting as shown in the example CR if you want to preserve the default links.
(string)
*Required*
The name of the annotation whose value is a URL to additional documentation useful to the user.
(string)
The name of the annotation whose value is used to determine what icon to display. The annotation name itself can be anything, but note that the value of that annotation must be one of: rest, grpc, and graphql - any other value is ignored.
(string)
*Required*
The title of the link that Kiali will display. The link will go to the URL specified in the value of the configured annotation.
(object)
Settings that control what namespaces are returned by Kiali.
(array)
A list of namespaces to be excluded from the list of namespaces provided by the Kiali API and Kiali UI. Regex is supported. This does not affect explicit namespace access.
(array)
A list of namespaces to be included in the list of namespaces provided by the Kiali API and Kiali UI (if those namespaces exist). Regex is supported. An undefined or empty list is ignored. This does not affect explicit namespace access.
(string)
A Kubernetes label selector (e.g. myLabel=myValue) which is used for filtering out namespaces
when fetching the list of available namespaces. This does not affect explicit namespace access.
(string)
A Kubernetes label selector (e.g. myLabel=myValue) which is used when fetching the list of
available namespaces. This does not affect explicit namespace access.
If deployment.accessible_namespaces does not have the special value of '**'
then the Kiali operator will add a new label to all accessible namespaces - that new
label will be this label_selector_include (this label is added regardless if the namespace matches the label_selector_exclude also).
Note that if you do not set this label_selector_include setting but deployment.accessible_namespaces
does not have the special “all namespaces” entry of '**' then this label_selector_include will be set
to a default value of kiali.io/[<deployment.instance_name>.]member-of=<deployment.namespace>
where [<deployment.instance_name>.] is the instance name assigned to the Kiali installation
if it is not the default ‘kiali’ (otherwise, this is omitted) and <deployment.namespace>
is the namespace where Kiali is to be installed.
(integer)
The amount of time in seconds Kiali will wait for a response from the OpenShift API server when requesting authentication results.
(string)
The Route resource name and OAuthClient resource name will have this value as its prefix. This value normally should never change. The installer will ensure this value is set correctly.
(integer)
Timeout that overrides the default OpenShift token inactivity timeout. This value represents the maximum amount of time in seconds that can occur between consecutive uses of the token. Tokens become invalid if they are not used within this temporal window. If 0, the Kiali tokens never timeout. OpenShift may have a minimum allowed value - see the OpenShift documentation specific for the version of OpenShift you are using. WARNING: existing tokens will not be affected by changing this setting.
(integer)
A time duration in seconds that overrides the default OpenShift access token max age. If 0 then there will be no expiration of tokens.
(string)
Determines what authentication strategy to use when users log into Kiali.
Options are anonymous, token, openshift, openid, or header.
- Choose
anonymous to allow full access to Kiali without requiring any credentials.
- Choose
token to allow access to Kiali using service account tokens, which controls
access based on RBAC roles assigned to the service account.
- Choose
openshift to use the OpenShift OAuth login which controls access based on
the individual’s RBAC roles in OpenShift. Not valid for non-OpenShift environments.
- Choose
openid to enable OpenID Connect-based authentication. Your cluster is required to
be configured to accept the tokens issued by your IdP. There are additional required
configurations for this strategy. See below for the additional OpenID configuration section.
- Choose
header when Kiali is running behind a reverse proxy that will inject an
Authorization header and potentially impersonation headers.
When empty, this value will default to openshift on OpenShift and token on other Kubernetes environments.
(array)
A list of user-defined custom monitoring dashboards that you can use to generate metrics charts
for your applications. The server has some built-in dashboards; if you define a custom dashboard here
with the same name as a built-in dashboard, your custom dashboard takes precedence and will overwrite
the built-in dashboard. You can disable one or more of the built-in dashboards by simply defining an
empty dashboard.
An example of an additional user-defined dashboard,
- name: myapp
  title: My App Metrics
  items:
  - chart:
      name: "Thread Count"
      spans: 4
      metricName: "thread-count"
      dataType: "raw"
An example of disabling a built-in dashboard (in this case, disabling the Envoy dashboard),
- name: envoy
To learn more about custom monitoring dashboards, see the documentation at https://kiali.io/docs/configuration/custom-dashboard/
(array)
When cluster_wide_access=false this must be set to the list of namespaces to which Kiali is to be given permissions. You can provide names using regex expressions matched against all namespaces the operator can see. If left unset it is required that cluster_wide_access be true, and Kiali will have permissions to all namespaces. The list of namespaces that a user can access is a subset of these namespaces, given that user’s RBAC settings.
(object)
Additional custom yaml to add to the service definition. This is used mainly to customize the service type. For example, if the deployment.service_type is set to ‘LoadBalancer’ and you want to set the loadBalancerIP, you can do so here with: additional_service_yaml: { 'loadBalancerIP': '78.11.24.19' }. Another example would be if the deployment.service_type is set to ‘ExternalName’ you will need to configure the name via: additional_service_yaml: { 'externalName': 'my.kiali.example.com' }. A final example would be if external IPs need to be set: additional_service_yaml: { 'externalIPs': ['80.11.12.10'] }
(object)
Affinity definitions that are to be used to define the nodes where the Kiali pod should be constrained. See the Kubernetes documentation on Assigning Pods to Nodes for the proper syntax for these three different affinity types.
(boolean)
Determines if the Kiali server will be granted cluster-wide permissions to see all namespaces. When true, this provides more efficient caching within the Kiali server. It must be true if deployment.accessible_namespaces is left unset. To limit the namespaces for which Kiali has permissions, set to false and list the desired namespaces in deployment.accessible_namespaces. When not set, this value will default to false if deployment.accessible_namespaces is set to a list of namespaces; otherwise this will be true.
(object)
Custom annotations to be created on the Kiali ConfigMap.
(array)
Defines additional secrets that are to be mounted in the Kiali pod.
These are useful to contain certs that are used by Kiali to securely connect to third party systems
(for example, see external_services.tracing.auth.ca_file).
These secrets must be created by an external mechanism. Kiali will not generate these secrets; it
is assumed these secrets are externally managed. You can define 0, 1, or more secrets.
An example configuration is,
custom_secrets:
- name: mysecret
  mount: /mysecret-path
- name: my-other-secret
  mount: /my-other-secret-location
  optional: true
(string)
*Required*
The file path location where the secret content will be mounted. The custom secret cannot be mounted on a path that the operator will use to mount its secrets. Make sure you set your custom secret mount path to a unique, unused path. Paths such as /kiali-configuration, /kiali-cert, /kiali-cabundle, and /kiali-secret should not be used as mount paths for custom secrets because the operator may want to use one of those paths.
(string)
*Required*
The name of the secret that is to be mounted to the Kiali pod’s file system. The name of the custom secret must not be the same name as one created by the operator. Names such as kiali, kiali-cert-secret, and kiali-cabundle should not be used as a custom secret name because the operator may want to create one with one of those names.
(boolean)
Indicates if the secret may or may not exist at the time the Kiali pod starts. This will default to ‘false’ if not specified.
(object)
Determines what (if any) HorizontalPodAutoscaler should be created to autoscale the Kiali pod.
A typical way to configure HPA for Kiali is,
hpa:
  api_version: "autoscaling/v2"
  spec:
    maxReplicas: 2
    minReplicas: 1
    metrics:
    - type: Resource
      resource:
        name: cpu
        target:
          type: Utilization
          averageUtilization: 50
(string)
A specific HPA API version that can be specified in case there is some HPA feature you want to use that is only supported in that specific version. If value is an empty string, an attempt will be made to determine a valid version.
(object)
The spec specified here will be placed in the created HPA resource’s ‘spec’ section. If spec is left empty, no HPA resource will be created. Note that you must not specify the ‘scaleTargetRef’ section in spec; the Kiali Operator will populate that for you.
(string)
If deployment.image_version is a digest hash, this value indicates what type of digest it is. A typical value would be ‘sha256’. Note: do NOT prefix this value with a ‘@’.
(string)
Determines which Kiali image to download and install. If you set this to a specific name (i.e. you do not leave it as the default empty string), you must make sure that image is supported by the operator. If empty, the operator will use a known supported image name based on which version was defined. Note that, as a security measure, a cluster admin may have configured the Kiali operator to ignore this setting. A cluster admin may do this to ensure the Kiali operator only installs a single, specific Kiali version, thus this setting may have no effect depending on how the operator itself was configured.
(string)
The Kubernetes pull policy for the Kiali deployment. This is overridden to be ‘Always’ if deployment.image_version is set to ‘latest’.
(array)
The names of the secrets to be used when container images are to be pulled.
(string)
Determines which version of Kiali to install.
Choose ‘lastrelease’ to use the last Kiali release.
Choose ‘latest’ to use the latest image (which may or may not be a released version of Kiali).
Choose ‘operator_version’ to use the image whose version is the same as the operator version.
Otherwise, you can set this to any valid Kiali version (such as ‘v1.0’) or any valid Kiali
digest hash (if you set this to a digest hash, you must indicate the digest in deployment.image_digest).
Note that if this is set to ‘latest’ then the deployment.image_pull_policy will be set to ‘Always’.
If you set this to a specific version (i.e. you do not leave it as the default empty string),
you must make sure that image is supported by the operator.
If empty, the operator will use a known supported image version based on which ‘version’ was defined.
Note that, as a security measure, a cluster admin may have configured the Kiali operator to
ignore this setting. A cluster admin may do this to ensure the Kiali operator only installs
a single, specific Kiali version, thus this setting may have no effect depending on how the
operator itself was configured.
(object)
Configures if/how the Kiali endpoint should be exposed externally.
(object)
Additional labels to add to the Ingress (or Route if on OpenShift). These are added to the labels that are created by default; these do not override the default labels.
(string)
If class_name is a non-empty string, it will be used as the ‘spec.ingressClassName’ in the created Kubernetes Ingress resource. This setting is ignored if on OpenShift. This is also ignored if override_yaml.spec is defined (i.e. you must define the ‘ingressClassName’ directly in your override yaml).
(boolean)
Determines if the Kiali endpoint should be exposed externally. If ‘true’, an Ingress will be created if on Kubernetes or a Route if on OpenShift. If left undefined, this will be ‘false’ on Kubernetes and ‘true’ on OpenShift.
(object)
Because an Ingress into a cluster can vary wildly in its desired configuration,
this setting provides a way to override complete portions of the Ingress resource
configuration (Ingress on Kubernetes and Route on OpenShift). It is up to the user
to ensure this override YAML configuration is valid and supports the cluster environment
since the operator will blindly copy this custom configuration into the resource it
creates.
This setting is not used if deployment.ingress.enabled is set to ‘false’.
Note that only ‘metadata.annotations’ and ‘spec’ is valid and only they will
be used to override those same sections in the created resource. You can define
either one or both.
Note that override_yaml.metadata.labels is not allowed - you cannot override the labels; to add
labels to the default set of labels, use the deployment.ingress.additional_labels setting.
Example,
override_yaml:
  metadata:
    annotations:
      nginx.ingress.kubernetes.io/secure-backends: "true"
      nginx.ingress.kubernetes.io/backend-protocol: "HTTPS"
  spec:
    rules:
    - http:
        paths:
        - path: /kiali
          pathType: Prefix
          backend:
            service
              name: "kiali"
              port:
                number: 20001
(string)
The instance name of this Kiali installation. This instance name will be the prefix prepended to the names of all Kiali resources created by the operator and will be used to label those resources as belonging to this Kiali installation instance. You cannot change this instance name after a Kiali CR is created. If you attempt to change it, the operator will abort with an error. If you want to change it, you must first delete the original Kiali CR and create a new one. Note that this does not affect the name of the auto-generated signing key secret. If you do not supply a signing key, the operator will create one for you in a secret, but that secret will always be named ‘kiali-signing-key’ and shared across all Kiali instances in the same deployment namespace. If you want a different signing key secret, you are free to create your own and tell the operator about it via login_token.signing_key. See the docs on that setting for more details. Note also that if you are setting this value, you may also want to change the installation_tag setting, but this is not required.
(object)
Configures the logger that emits messages to the Kiali server pod logs.
(string)
Indicates if the logs should be written with one log message per line or using a JSON format. Must be one of: text or json.
(string)
The lowest priority of messages to log. Must be one of: trace, debug, info, warn, error, or fatal.
(string)
With this setting every sampler_rate-th message will be logged. By default, every message is logged. As an example, setting this to '2' means every other message will be logged. The value of this setting is a string but must be parsable as an integer.
(string)
The namespace into which Kiali is to be installed. If this is empty or not defined, the default will be the namespace where the Kiali CR is located.
(object)
A set of node labels that dictate onto which node the Kiali pod will be deployed.
(object)
Custom annotations to be created on the Kiali pod.
(object)
Custom labels to be created on the Kiali pod.
An example use for this setting is to inject an Istio sidecar such as,
sidecar.istio.io/inject: "true"
(string)
The priorityClassName used to assign the priority of the Kiali pod.
(integer)
The replica count for the Kiail deployment.
(object)
Defines compute resources that are to be given to the Kiali pod’s container. The value is a dict as defined by Kubernetes. See the Kubernetes documentation (https://kubernetes.io/docs/concepts/configuration/manage-compute-resources-container).
If you set this to an empty dict ({}) then no resources will be defined in the Deployment.
If you do not set this at all, the default is,
requests:
  cpu: "10m"
  memory: "64Mi"
limits:
  memory: "1Gi"
(object)
Custom security context to be placed on the server container. The entire security context on the container will be the value of this setting if the operator is configured to allow it. Note that, as a security measure, a cluster admin may have configured the Kiali operator to not allow portions of this override setting - in this case you can specify additional security context settings but you cannot replace existing, default ones.
(object)
Custom annotations to be created on the Kiali Service resource.
(string)
The Kiali service type. Kubernetes determines what values are valid. Common values are ‘NodePort’, ‘ClusterIP’, and ‘LoadBalancer’.
(array)
A list of tolerations which declare which node taints Kiali can tolerate. See the Kubernetes documentation on Taints and Tolerations for more details.
(string)
DEPRECATED! Determines which priority levels of log messages Kiali will output. Use deployment.logger settings instead.
(string)
Kiali resources will be assigned a ‘version’ label when they are deployed.
This setting determines what value those ‘version’ labels will have.
When empty, its default will be determined as follows,
- If
deployment.image_version is ‘latest’, version_label will be fixed to ‘master’.
- If
deployment.image_version is ‘lastrelease’, version_label will be fixed to the last Kiali release version string.
- If
deployment.image_version is anything else, version_label will be that value, too.
(boolean)
When true, Kiali will be in ‘view only’ mode, allowing the user to view and retrieve management and monitoring data for the service mesh, but not allow the user to modify the service mesh.
(object)
These external service configuration settings define how to connect to the external services
like Prometheus, Grafana, and Jaeger.
Regarding sensitive values in the external_services ‘auth’ sections:
Some external services configured below support an ‘auth’ sub-section in order to tell Kiali
how it should authenticate with the external services. Credentials used to authenticate Kiali
to those external services can be defined in the auth.password and auth.token values
within the auth sub-section. Because these are sensitive values, you may not want to declare
the actual credentials here in the Kiali CR. In this case, you may store the actual password
or token string in a Kubernetes secret. If you do, you need to set the auth.password or
auth.token to a value in the format secret:<secretName>:<secretKey> where <secretName>
is the name of the secret object that Kiali can access, and <secretKey> is the name of the
key within the named secret that contains the actual password or token string. For example,
if Grafana requires a password, you can store that password in a secret named ‘myGrafanaCredentials’
in a key named ‘myGrafanaPw’. In this case, you would set external_services.grafana.auth.password
to secret:myGrafanaCredentials:myGrafanaPw.
(object)
Settings for enabling and discovering custom dashboards.
(integer)
Threshold of the number of pods, for a given Application or Workload, above which dashboards discovery will be skipped. This setting only takes effect when discovery_enabled is set to ‘auto’.
(string)
Enable, disable or set ‘auto’ mode to the dashboards discovery process. If set to ‘true’, Kiali will always try to discover dashboards based on metrics. Note that this can generate performance penalties while discovering dashboards for workloads having many pods (thus many metrics). When set to ‘auto’, Kiali will skip dashboards discovery for workloads with more than a configured threshold of pods (see discovery_auto_threshold). When discovery is disabled or auto/skipped, it is still possible to tie workloads with dashboards through annotations on pods (refer to the doc https://kiali.io/docs/configuration/custom-dashboard/#pod-annotations). Value must be one of: true, false, auto.
(boolean)
Enable or disable custom dashboards, including the dashboards discovery process.
(boolean)
Used in the Components health feature. When true, the unhealthy scenarios will be raised as errors. Otherwise, they will be raised as a warning.
(string)
The Prometheus label name used for identifying namespaces in metrics for custom dashboards. The default is namespace but you may want to use kubernetes_namespace depending on your Prometheus configuration.
(object)
The Prometheus configuration defined here refers to the Prometheus instance that is dedicated to fetching metrics for custom dashboards. This means you can obtain these metrics for the custom dashboards from a Prometheus instance that is different from the one that Istio uses. If this section is omitted, the same Prometheus that is used to obtain the Istio metrics will also be used for retrieving custom dashboard metrics.
(object)
Settings used to authenticate with the Prometheus instance.
(string)
The certificate authority file to use when accessing Prometheus using https. An empty string means no extra certificate authority file is used.
(boolean)
Set true to skip verifying certificate validity when Kiali contacts Prometheus over https.
(string)
Password to be used when making requests to Prometheus, for basic authentication. May refer to a secret.
(string)
Token / API key to access Prometheus, for token-based authentication. May refer to a secret.
(string)
The type of authentication to use when contacting the server. Use bearer to send the token to the Prometheus server. Use basic to connect with username and password credentials. Use none to not use any authentication (this is the default).
(boolean)
When true and if auth.type is bearer, Kiali Service Account token will be used for the API calls to Prometheus (in this case, auth.token config is ignored).
(string)
Username to be used when making requests to Prometheus with basic authentication.
(integer)
Prometheus caching duration expressed in seconds.
(boolean)
Enable/disable Prometheus caching used for Health services.
(integer)
Prometheus caching expiration expressed in seconds.
(object)
A set of name/value settings that will be passed as headers when requests are sent to Prometheus.
(string)
Used in the Components health feature. This is the url which Kiali will ping to determine whether the component is reachable or not. It defaults to url when not provided.
(boolean)
Used in the Components health feature. When true, the unhealthy scenarios will be raised as errors. Otherwise, they will be raised as a warning.
(object)
A set of labelName/labelValue settings applied to every Prometheus query. Used to narrow unified metrics to only those scoped to the Kiali instance.
(object)
Define this section if Prometheus is to be queried through a Thanos proxy. Kiali will still use the url setting to query for Prometheus metrics so make sure that is set appropriately.
(boolean)
Set to true when a Thanos proxy is in front of Prometheus.
(string)
Thanos Retention period value expresed as a string.
(string)
Thanos Scrape interval value expresed as a string.
(string)
The URL used to query the Prometheus Server. This URL must be accessible from the Kiali pod. If empty, the default will assume Prometheus is in the Istio control plane namespace; e.g. http://prometheus.<istio_namespace>:9090.
(object)
Configuration used to access the Grafana dashboards.
(object)
Settings used to authenticate with the Grafana instance.
(string)
The certificate authority file to use when accessing Grafana using https. An empty string means no extra certificate authority file is used.
(boolean)
Set true to skip verifying certificate validity when Kiali contacts Grafana over https.
(string)
Password to be used when making requests to Grafana, for basic authentication. May refer to a secret.
(string)
Token / API key to access Grafana, for token-based authentication. May refer to a secret.
(string)
The type of authentication to use when contacting the server. Use bearer to send the token to the Grafana server. Use basic to connect with username and password credentials. Use none to not use any authentication (this is the default).
(boolean)
When true and if auth.type is bearer, Kiali Service Account token will be used for the API calls to Grafana (in this case, auth.token config is ignored).
(string)
Username to be used when making requests to Grafana with basic authentication.
(array)
A list of Grafana dashboards that Kiali can link to.
(string)
The name of the Grafana dashboard.
(string)
The name of a variable that holds the app name, if used in that dashboard (else it must be omitted).
(string)
The name of a variable that holds the namespace, if used in that dashboard (else it must be omitted).
(string)
The name of a variable that holds the service name, if used in that dashboard (else it must be omitted).
(string)
The name of a variable that holds the workload name, if used in that dashboard (else it must be omitted).
(boolean)
When true, Grafana support will be enabled in Kiali.
(string)
Used in the Components health feature. This is the URL which Kiali will ping to determine whether the component is reachable or not. It defaults to in_cluster_url when not provided.
(string)
The URL used for in-cluster access. An example would be http://grafana.istio-system:3000. This URL can contain query parameters if needed, such as ‘?orgId=1’. If not defined, it will default to http://grafana.<istio_namespace>:3000.
(boolean)
Used in the Components health feature. When true, the unhealthy scenarios will be raised as errors. Otherwise, they will be raised as a warning.
(string)
The URL that Kiali uses when integrating with Grafana. This URL must be accessible to clients external to the cluster in order for the integration to work properly. If empty, an attempt to auto-discover it is made. This URL can contain query parameters if needed, such as ‘?orgId=1’.
(object)
Istio configuration that Kiali needs to know about in order to observe the mesh.
(object)
Istio components whose status will be monitored by Kiali.
(array)
A specific Istio component whose status will be monitored by Kiali.
(string)
Istio component pod app label.
(boolean)
Whether the component is to be considered a core component for your deployment.
(boolean)
Whether the component is a native Envoy proxy.
(string)
The namespace where the component is installed. It defaults to the Istio control plane namespace (e.g. istio_namespace) setting. Note that the Istio documentation suggests you install the ingress and egress to different namespaces, so you most likely will want to explicitly set this namespace value for the ingress and egress components.
(boolean)
Determines if Istio component statuses will be displayed in the Kiali masthead indicator.
(string)
The name of the istio control plane config map.
(integer)
The port which kiali will open to fetch envoy config data information.
(string)
The K8s Gateway API GatewayClass’s Name used in Istio. If empty, the default value ‘istio’ is used.
(boolean)
Indicates if Kiali has access to istiod. true by default.
(object)
These values are used in Canary upgrade/downgrade functionality when istio_upgrade_action is true.
(string)
The currently installed Istio revision.
(string)
The installed Istio canary revision to upgrade to.
(string)
The annotation used by Istio to identify domains.
(string)
The name of the field that annotates a workload to indicate a sidecar should be automatically injected by Istio. This is the name of a Kubernetes annotation. Note that some Istio implementations also support labels by the same name. In other words, if a workload has a Kubernetes label with this name, that may also trigger automatic sidecar injection.
(string)
The pod annotation used by Istio to identify the sidecar.
(string)
The name of the istio-sidecar-injector config map.
(string)
The name of the istiod deployment.
(integer)
The monitoring port of the IstioD pod (not the Service).
(string)
The namespace to treat as the administrative root namespace for Istio configuration.
(string)
The Istio service used to determine the Istio version. If empty, assumes the URL for the well-known Istio version endpoint.
(object)
The Prometheus configuration defined here refers to the Prometheus instance that is used by Istio to store its telemetry.
(object)
Settings used to authenticate with the Prometheus instance.
(string)
The certificate authority file to use when accessing Prometheus using https. An empty string means no extra certificate authority file is used.
(boolean)
Set true to skip verifying certificate validity when Kiali contacts Prometheus over https.
(string)
Password to be used when making requests to Prometheus, for basic authentication. May refer to a secret.
(string)
Token / API key to access Prometheus, for token-based authentication. May refer to a secret.
(string)
The type of authentication to use when contacting the server. Use bearer to send the token to the Prometheus server. Use basic to connect with username and password credentials. Use none to not use any authentication (this is the default).
(boolean)
When true and if auth.type is bearer, Kiali Service Account token will be used for the API calls to Prometheus (in this case, auth.token config is ignored).
(string)
Username to be used when making requests to Prometheus with basic authentication.
(integer)
Prometheus caching duration expressed in seconds.
(boolean)
Enable/disable Prometheus caching used for Health services.
(integer)
Prometheus caching expiration expressed in seconds.
(object)
A set of name/value settings that will be passed as headers when requests are sent to Prometheus.
(string)
Used in the Components health feature. This is the url which Kiali will ping to determine whether the component is reachable or not. It defaults to url when not provided.
(boolean)
Used in the Components health feature. When true, the unhealthy scenarios will be raised as errors. Otherwise, they will be raised as a warning.
(object)
A set of labelName/labelValue settings applied to every Prometheus query. Used to narrow unified metrics to only those scoped to the Kiali instance.
(object)
Define this section if Prometheus is to be queried through a Thanos proxy. Kiali will still use the url setting to query for Prometheus metrics so make sure that is set appropriately.
(boolean)
Set to true when a Thanos proxy is in front of Prometheus.
(string)
Thanos Retention period value expresed as a string.
(string)
Thanos Scrape interval value expresed as a string.
(string)
The URL used to query the Prometheus Server. This URL must be accessible from the Kiali pod. If empty, the default will assume Prometheus is in the Istio control plane namespace; e.g. http://prometheus.<istio_namespace>:9090.
(object)
Configuration used to access the Tracing (Jaeger) dashboards.
(object)
Settings used to authenticate with the Tracing server instance.
(string)
The certificate authority file to use when accessing the Tracing server using https. An empty string means no extra certificate authority file is used.
(boolean)
Set true to skip verifying certificate validity when Kiali contacts the Tracing server over https.
(string)
Password to be used when making requests to the Tracing server, for basic authentication. May refer to a secret.
(string)
Token / API key to access the Tracing server, for token-based authentication. May refer to a secret.
(string)
The type of authentication to use when contacting the server. Use bearer to send the token to the Tracing server. Use basic to connect with username and password credentials. Use none to not use any authentication (this is the default).
(boolean)
When true and if auth.type is bearer, Kiali Service Account token will be used for the API calls to the Tracing server (in this case, auth.token config is ignored).
(string)
Username to be used when making requests to the Tracing server with basic authentication.
(boolean)
When true, connections to the Tracing server are enabled. in_cluster_url and/or url need to be provided.
(string)
Set URL for in-cluster access, which enables further integration between Kiali and Jaeger. When not provided, Kiali will only show external links using the url setting. Note: Jaeger v1.20+ has separated ports for GRPC(16685) and HTTP(16686) requests. Make sure you use the appropriate port according to the use_grpc value. Example: http://tracing.istio-system:16685
(boolean)
Used in the Components health feature. When true, the unhealthy scenarios will be raised as errors. Otherwise, they will be raised as a warning.
(boolean)
Kiali use this boolean to find traces with a namespace selector : service.namespace.
(object)
A set of tagKey/tagValue settings applied to every Jaeger query. Used to narrow unified traces to only those scoped to the Kiali instance.
(integer)
The amount of time in seconds Kiali will wait for a response from ‘jaeger-query’ service when fetching traces.
(string)
The external URL that will be used to generate links to Jaeger. It must be accessible to clients external to the cluster (e.g: a browser) in order to generate valid links. If the tracing service is deployed with a QUERY_BASE_PATH set, set this URL like https:///. For example, https://tracing-service:8080/jaeger
(boolean)
Set to true in order to enable GRPC connections between Kiali and Jaeger which will speed up the queries. In some setups you might not be able to use GRPC (e.g. if Jaeger is behind some reverse proxy that doesn’t support it). If not specified, this will defalt to ‘false’ if deployed within a Maistra/OSSM+OpenShift environment, ‘true’ otherwise.
(array)
Kiali will get the traces of these services found in the Istio control plane namespace.
(string)
A name of a service found in the Istio control plane namespace whose traces will be retrieved by Kiali.
(string)
The type of resource that this configuration applies to. This is a regular expression.
(string)
The name of a resource that this configuration applies to. This is a regular expression.
(string)
The name of the namespace that this configuration applies to. This is a regular expression.
(array)
A list of tolerances for this configuration.
(string)
The status code that applies for this tolerance. This is a regular expression.
(integer)
Health will be considered degraded when the telemetry reaches this value (specified as an integer representing a percentage).
(string)
The direction that applies for this tolerance (e.g. inbound or outbound). This is a regular expression.
(integer)
A failure status will be shown when the telemetry reaches this value (specified as an integer representing a percentage).
(string)
The protocol that applies for this tolerance (e.g. grpc or http). This is a regular expression.
(object)
Settings that define the Kiali server identity.
(string)
Certificate file used to identify the Kiali server. If set, you must go over https to access Kiali. The Kiali operator will set this if it deploys Kiali behind https. When left undefined, the operator will attempt to generate a cluster-specific cert file that provides https by default (today, this auto-generation of a cluster-specific cert is only supported on OpenShift). When set to an empty string, https will be disabled.
(string)
Private key file used to identify the Kiali server. If set, you must go over https to access Kiali. When left undefined, the Kiali operator will attempt to generate a cluster-specific private key file that provides https by default (today, this auto-generation of a cluster-specific private key is only supported on OpenShift). When set to an empty string, https will be disabled.
(string)
Tag used to identify a particular instance/installation of the Kiali server. This is merely a human-readable string that will be used within Kiali to help a user identify the Kiali being used (e.g. in the Kiali UI title bar). See deployment.instance_name for the setting used to customize Kiali resource names that are created.
(object)
Defines specific labels used by Istio that Kiali needs to know about.
(string)
The name of the label used to define what application a workload belongs to. This is typically something like app or app.kubernetes.io/name.
(string)
The name of the label used to instruct Istio to automatically inject sidecar proxies when applications are deployed.
(string)
The label used to identify the Istio revision.
(string)
The name of the label used to define what version of the application a workload belongs to. This is typically something like version or app.kubernetes.io/version.
(string)
The namespace where Istio is installed. If left empty, it is assumed to be the same namespace as where Kiali is installed (i.e. deployment.namespace).
(object)
Kiali features that can be enabled or disabled.
(object)
Flag to enable/disable displaying certificates information and which secrets to grant read permissions.
(object)
Multi-cluster related features.
(object)
Settings to allow cluster secrets to be auto-detected. Secrets must exist in the Kiali deployment namespace.
(boolean)
If true then remote cluster secrets will be autodetected during the installation of the Kiali Server Deployment. Any remote cluster secrets found in the Kiali deployment namespace will be mounted to the Kiali Server’s file system. If false, you can still manually specify the remote cluster secret information in the ‘clusters’ setting if you wish to utilize multicluster features.
(string)
The name and value of a label that exists on all remote cluster secrets. Default is ‘kiali.io/multiCluster=true’.
(array)
A list of clusters that the Kiali Server can access. You need to specify the remote clusters here if ‘autodetect_secrets.enabled’ is false.
(string)
The name of the secret that contains the credentials necessary to connect to the remote cluster. This secret must exist in the Kiali deployment namespace.
(array)
A map between cluster name, instance name and namespace to a Kiali URL. Will be used showing the Mesh page’s Kiali URLs. The Kiali service’s ‘kiali.io/external-url’ annotation will be overridden when this property is set.
(string)
The instance name of this Kiali installation. This should be the value used in deployment.instance_name for Kiali resource name.
(string)
The namespace into which Kiali is installed.
(string)
The URL of Kiali in the cluster.
(array)
There may be some features that admins do not want to be accessible to users (even in ‘view only’ mode). In this case, this setting allows you to disable one or more of those features entirely.
(boolean)
Flag to enable/disable an Action to edit annotations.
(boolean)
Flag to enable/disable an Action to label a namespace for automatic Istio Sidecar injection.
(boolean)
Flag to activate the Kiali functionality of upgrading namespaces to point to an installed Istio Canary revision. Related Canary upgrade and current revisions of Istio should be defined in istio_canary_revision section.
(object)
Default settings for the UI. These defaults apply to all users.
(object)
Default settings for the Graph UI.
(array)
A list of commonly used and useful find expressions that will be provided to the user out-of-box.
(boolean)
If true this option will be selected and take effect automatically. Note that only one option in the list can have this value be set to true.
(string)
Human-readable text to let the user know what the expression does.
(array)
A list of commonly used and useful hide expressions that will be provided to the user out-of-box.
(boolean)
If true this option will be selected and take effect automatically. Note that only one option in the list can have this value be set to true.
(string)
Human-readable text to let the user know what the expression does.
(object)
These settings determine which rates are used to determine graph traffic.
(string)
gRPC traffic is measured in requests or sent/received/total messages. Value must be one of: none, requests, sent, received, or total.
(string)
HTTP traffic is measured in requests. Value must be one of: none or requests.
(string)
TCP traffic is measured in sent/received/total bytes. Only request traffic supplies response codes. Value must be one of: none, sent, received, or total.
(object)
Default settings for the List views (Apps, Workloads, etc).
(boolean)
Include Health column (by default) for applicable list views. Setting to false can improve performance.
(boolean)
Include Istio resources (by default) in Details column for applicable list views. Setting to false can improve performance.
(boolean)
Include Configuration validation column (by default) for applicable list views. Setting to false can improve performance.
(boolean)
If true list pages display checkbox toggles for the include options, Otherwise the configured settings are applied but can not be changed by the user. Default is false.
(object)
Additional label aggregation for inbound metric pages in detail pages.
You will see these configurations in the ‘Metric Settings’ drop-down.
An example,
metrics_inbound:
  aggregations:
  - display_name: Istio Network
    label: topology_istio_io_network
  - display_name: Istio Revision
    label: istio_io_rev
(object)
Additional label aggregation for outbound metric pages in detail pages.
You will see these configurations in the ‘Metric Settings’ drop-down.
An example,
metrics_outbound:
  aggregations:
  - display_name: Istio Network
    label: topology_istio_io_network
  - display_name: Istio Revision
    label: istio_io_rev
(string)
Duration of metrics to fetch on each refresh. Value must be one of: 1m, 2m, 5m, 10m, 30m, 1h, 3h, 6h, 12h, 1d, 7d, or 30d
(array)
Default selections for the namespace selection dropdown. Non-existent or inaccessible namespaces will be ignored. Omit or set to an empty array for no default namespaces.
(string)
The automatic refresh interval for pages offering automatic refresh. Value must be one of: pause, 10s, 15s, 30s, 1m, 5m or 15m
(object)
Features specific to the validations subsystem.
(array)
A list of one or more validation codes whose errors are to be ignored.
(string)
A validation code (e.g. KIA0101) for a specific validation error that is to be ignored.
(boolean)
The KIA0301 validation checks duplicity of host and port combinations across all Istio Gateways. This includes also Gateways with ‘*’ in hosts. But Istio considers such a Gateway with a wildcard in hosts as the last in order, after the Gateways with FQDN in hosts. This option is to skip Gateways with wildcards in hosts from the KIA0301 validations but still keep Gateways with FQDN hosts.
(object)
Configuration of Kiali’s access of the Kubernetes API.
(integer)
The Burst value of the Kubernetes client.
(integer)
The ratio interval (expressed in seconds) used for the cache to perform a full refresh. Only used when cache_enabled is true.
(integer)
This Kiali cache is a list of namespaces per user. This is typically a short-lived cache compared with the duration of the namespace cache defined by the cache_duration setting. This is specified in seconds.
(string)
The name of the cluster Kiali is deployed in. This is only used in multi cluster environments. If not set, Kiali will try to auto detect the cluster name from the Istiod deployment or use the default ‘Kubernetes’.
(array)
List of controllers that won’t be used for Workload calculation. Kiali queries Deployment, ReplicaSet, ReplicationController, DeploymentConfig, StatefulSet, Job and CronJob controllers. Deployment and ReplicaSet will be always queried, but ReplicationController, DeploymentConfig, StatefulSet, Job and CronJobs can be skipped from Kiali workloads queries if they are present in this list.
(integer)
The QPS value of the Kubernetes client.
(integer)
A user’s login token expiration specified in seconds. This is applicable to token and header auth strategies only.
(string)
The signing key used to generate tokens for user authentication. Because this is potentially sensitive, you have the option to store this value in a secret. If you store this signing key value in a secret, you must indicate what key in what secret by setting this value to a string in the form of secret:<secretName>:<secretKey>. If left as an empty string, a secret with a random signing key will be generated for you. The signing key must be 16, 24 or 32 byte long.
(object)
Configuration that controls some core components within the Kiali Server.
(string)
Where the Kiali server is bound. The console and API server are accessible on this host.
(boolean)
When true, allows additional audit logging on write operations.
(boolean)
When true, allows the web console to send requests to other domains other than where the console came from. Typically used for development environments only.
(boolean)
When true, Kiali serves http requests with gzip enabled (if the browser supports it) when the requests are over 1400 bytes.
(object)
Settings to enable observability into the Kiali server itself.
(object)
Settings that control how Kiali itself emits its own metrics.
(boolean)
When true, the metrics endpoint will be available for Prometheus to scrape.
(integer)
The port that the server will bind to in order to receive metric requests. This is the port Prometheus will need to scrape when collecting metrics from Kiali.
(object)
Settings that control how the Kiali server itself emits its own tracing data.
(string)
The collector type to use. Value must be one of: jaeger or otel.
(string)
The URL used to determine where the Kiali server tracing data will be stored.
(boolean)
When true, the Kiali server itself will product its own tracing data.
(object)
Specific properties when the collector type is otel.
(string)
Protocol. Supported values are: http, https or grpc.
(integer)
The port that the server will bind to in order to receive console and API requests.
(string)
Defines the public domain where Kiali is being served. This is the ‘domain’ part of the URL (usually it’s a fully-qualified domain name). For example, kiali.example.org. When empty, Kiali will try to guess this value from HTTP headers. On non-OpenShift clusters, you must populate this value if you want to enable cross-linking between Kiali instances in a multi-cluster setup.
(string)
Define the history mode of kiali UI. Value must be one of: browser or hash.
(string)
Defines the ingress port where the connections come from. This is usually necessary when the application responds through a proxy/ingress, and it does not forward the correct headers (when this happens, Kiali cannot guess the port). When empty, Kiali will try to guess this value from HTTP headers.
(string)
Defines the context root path for the Kiali console and API endpoints and readiness probes. When providing a context root path that is not /, do not add a trailing slash (i.e. use /kiali not /kiali/). When empty, this will default to / on OpenShift and /kiali on other Kubernetes environments.
(string)
Defines the public HTTP schema used to serve Kiali. Value must be one of: http or https. When empty, Kiali will try to guess this value from HTTP headers. On non-OpenShift clusters, you must populate this value if you want to enable cross-linking between Kiali instances in a multi-cluster setup.
(string)
The version of the Ansible playbook to execute in order to install that version of Kiali.
It is rare you will want to set this - if you are thinking of setting this, know what you are doing first.
The only supported value today is default.
If not specified, a default version of Kiali will be installed which will be the most recent release of Kiali.
Refer to this file to see where these values are defined in the master branch,
https://github.com/kiali/kiali-operator/tree/master/playbooks/default-supported-images.yml
This version setting affects the defaults of the deployment.image_name and
deployment.image_version settings. See the comments for those settings
below for additional details. But in short, this version setting will
dictate which version of the Kiali image will be deployed by default.
Note that if you explicitly set deployment.image_name and/or
deployment.image_version you are responsible for ensuring those settings
are compatible with this setting (i.e. the Kiali image must be compatible
with the rest of the configuration and resources the operator will install).
(object)
The processing status of this CR as reported by the Kiali operator.
6 - Multi-cluster
Configuring Kiali for a multi-cluster mesh.
Kiali has experimental support for Istio multi-cluster installations.
Before proceeding with the setup, ensure you meet the requirements.
Requirements
-
Primary-remote istio deployment. Only the primary-remote istio deployment is currently supported.
-
Aggregated metrics and traces. Kiali needs a single endpoint for metrics and a single endpoint for traces where it can consume aggregated metrics/traces across all clusters. There are many ways to aggregate metrics/traces such as prometheus federation or using OTEL collector pipelines but setting these up are outside of the scope of Kiali.
-
Anonymous or OpenID authentication strategy. The unified multi-cluster configuration currently only supports anonymous or OpenID authentication strategies. In addition, current support varies by provider for OpenID across clusters.
Setup
The unified Kiali multi-cluster setup requires the Kiali Service Account (SA) to have read access to each Kubernetes cluster in the mesh. This is separate from the user credentials that are required when a user logs into Kiali. The user credentials are used to check user access to a namespace and to perform write operations. In anonymous mode, the Kiali SA is used for all operations and write access is also required. To give the Kiali SA access to each remote cluster, a kubeconfig with credentials needs to be created and mounted into the Kiali pod. While the location of Kiali in relation to the controlplane and dataplane may change depending on your istio deployment model, the requirements will remain the same.
-
Create a remote kubeconfig secret. You can use this script to simplify this process for you. Running this script will:
- Create a Kiali Service Account in the remote cluster.
- Create a role/role-binding for this service account in the remote cluster.
- Create a kubeconfig file and save this as a secret in the namespace where Kiali is deployed. The Kiali operator will auto-detect the secret and mount it into the Kiali pod.
In order to run this script you will need adequate permissions configured in your local kubeconfig, for both the cluster on which Kiali is deployed and the remote cluster. You will need to repeat this step for each remote cluster.
curl -L -o kiali-prepare-remote-cluster.sh https://raw.githubusercontent.com/kiali/kiali/master/hack/istio/multicluster/kiali-prepare-remote-cluster.sh
chmod +x kiali-prepare-remote-cluster.sh
./kiali-prepare-remote-cluster.sh --kiali-cluster-context east --remote-cluster-context west --view-only false
Adding remote kubeconfig secrets to Kiali effectively puts Kiali in “multi-cluster” mode and Kiali will begin using those credentials to communicate with the other clusters in the mesh.
- Optional - Configure tracing with cluster ID. By default, traces do not include their cluster name in the trace tags however this can be added using the istio telemetry API.
kubectl apply -f - <<EOF
apiVersion: telemetry.istio.io/v1alpha1
kind: Telemetry
metadata:
  name: mesh-default
  namespace: istio-system
spec:
  # no selector specified, applies to all workloads
  tracing:
  -  customTags:
      cluster:
        environment:
          name: "ISTIO_META_CLUSTER_ID"
EOF
-
Optional - Configure user access in your OIDC provider. When using anonymous mode, the Kiali SA credentials will be used to display mesh info to the user. When not using anonymous mode, Kiali will check the user’s access to each configured cluster’s namespace before showing the user any resources from that namespace. Please refer to your OIDC provider’s instructions for configuring user access to a kube cluster for this.
-
Optional - Narrow metrics to mesh. If your unified metrics store also contains data outside of your mesh, you can limit which metrics Kiali will query for by setting the query_scope configuration.
That’s it! From here you can login to Kiali and manage your mesh across both clusters from a single Kiali instance.
7 - Namespace access control
Configuring per-user authorized namespaces.
Introduction
In authentication strategies other than anonymous Kiali supports limiting the
namespaces that are accessible on a per-user basis. The anonymous
authentication strategy does not support this, although you can still limit
privileges when using an OpenShift cluster. See the access control section in
Anonymous strategy.
To authorize namespaces, the standard Roles resources (or ClusterRoles)
and RoleBindings resources (or ClusterRoleBindings) are used.
Kiali can only restrict or grant read access to namespaces as a whole. So,
keep in mind that while the RBAC capabilities of the cluster are used to give
access, Kiali won’t offer the same privilege granularity that the cluster
supports. For example, a user that does not have privileges to get Kubernetes
Deployments via typical tools (e.g. kubectl) would still be able to get
some details of Deployments through Kiali when listing Workloads or when
viewing detail pages, or in the
Graph.
Some features allow creating or changing resources in the cluster (for example,
the Wizards). For these write
operations which may be sensitive, the users will need to have the required
privileges in the cluster to perform updates - i.e. the cluster RBAC takes
effect.
Kiali is going to reject login to users that aren’t authorized to see any namespace.
Granting access to namespaces
In general, Kiali will give read access to namespaces where the logged in
user is allowed to “GET” its definition – i.e. the user is allowed to do a
GET call to the api/v1/namespaces/{namespace-name} endpoint of the cluster
API. Users granted the LIST verb would get access to all namespaces of the
cluster (that’s a GET call to the api/v1/namespaces endpoint of the cluster
API).
You, probably, will want to have this small ClusterRole to help you in
authorizing individual namespaces in Kiali:
apiVersion: rbac.authorization.k8s.io/v1
kind: ClusterRole
metadata:
  name: kiali-namespace-authorization
rules:
- apiGroups: [""]
  resources:
  - namespaces
  - pods/log
  verbs:
  - get
- apiGroups: ["project.openshift.io"] # Only if you are using OpenShift
  resources:
  - projects
  verbs:
  - get
The
pods/log privilege is needed for the
pods Logs view.
Since logs are potentially sensitive, you could remove that privilege if you
don’t want users to be able to fetch pod logs.
Once you have created this ClusterRole, you would authorize a namespace
foobar to user john with the following RoleBinding:
apiVersion: rbac.authorization.k8s.io/v1
kind: RoleBinding
metadata:
  name: authorize-ns-foobar-to-john
  namespace: foobar
subjects:
- kind: User
  name: john
  apiGroup: rbac.authorization.k8s.io
roleRef:
  kind: ClusterRole
  name: kiali-namespace-authorization # The name of the ClusterRole created previously
  apiGroup: rbac.authorization.k8s.io
Note that in this example, the subject kind is User, which is the case when
using openid or openshift authentication strategies. For other
authentication strategies you would need to adjust the RoleBinding to use the
right subject kind.
If you want to authorize a user to access all namespaces in the cluster, the
most efficient way to do it is by creating a ClusterRole with the list verb
for namespaces and bind it to the user using a ClusterRoleBinding:
apiVersion: rbac.authorization.k8s.io/v1
kind: ClusterRole
metadata:
  name: kiali-all-namespaces-authorization
rules:
- apiGroups: [""]
  resources:
  - namespaces
  - pods/log
  verbs:
  - get
  - list
- apiGroups: ["project.openshift.io"] # Only if you are using OpenShift
  resources:
  - projects
  verbs:
  - get
---
apiVersion: rbac.authorization.k8s.io/v1
kind: ClusterRoleBinding
metadata:
  name: authorize-all-namespaces-to-john
subjects:
- kind: User
  name: john
  apiGroup: rbac.authorization.k8s.io
roleRef:
  kind: ClusterRole
  name: kiali-all-namespaces-authorization
  apiGroup: rbac.authorization.k8s.io
Note that the only addition to the ClusterRole is the list verb in the first rule.
Alternatively, you could also use the previously mentioned
kiali-namespace-authorization rather than creating a new one with the list
privilege, and it will work. However, Kiali will perform better if you grant the
list privilege.
Please read your cluster RBAC documentation to learn more about the
authorization system.
Granting write privileges to namespaces
Changing resources in the cluster can be a sensitive operation. Because of
this, the logged in user will need to be given the needed privileges to perform
any updates through Kiali. The following ClusterRole contains all read and write
privileges that may be used in Kiali:
apiVersion: rbac.authorization.k8s.io/v1
kind: ClusterRole
metadata:
  name: kiali-write-privileges
rules:
- apiGroups: [""]
  resources:
  - namespaces
  - pods
  - replicationcontrollers
  - services
  verbs:
  - patch
- apiGroups: ["extensions", "apps"]
  resources:
  - daemonsets
  - deployments
  - replicasets
  - statefulsets
  verbs:
  - patch
- apiGroups: ["batch"]
  resources:
  - cronjobs
  - jobs
  verbs:
  - patch
- apiGroups:
  - networking.istio.io
  - security.istio.io
  - extensions.istio.io
  - telemetry.istio.io
  - gateway.networking.k8s.io
  resources: ["*"]
  verbs:
  - get
  - list
  - watch
  - create
  - delete
  - patch
If needed, you can reduce the set of write privileges to prevent users from changing
unwanted resources. However read privileges are require to read the resources.
Similarly to giving access to namespaces, you can either use a RoleBinding to
give read and write privileges only to specific namespaces, or use a
ClusterRoleBinding to give privileges to all namespaces.
8 - Namespace Management
Configuring the namespaces accessible and visible to Kiali.
Introduction
The default Kiali installation (as mentioned in the Installation guide) gives Kiali access to all
namespaces available in the cluster.
It is possible to restrict Kiali to a set of desired namespaces by providing a list
of the ones you want, excluding the ones you don’t want. You can also filter namespaces by using Istio’s discovery selectors. You can use a combination of these options together.
As of Kiali 1.67, the following settings are deprecated:
- api.namespaces.exclude
- api.namespaces.include
- api.namespaces.label_selector_exclude
- api.namespaces.label_selector_include
It is recommended to instead use Istio Discovery Selectors to limit the namespaces in the mesh.
Accessible Namespaces
The “accessible namespaces” setting configures which namespaces are accessible to the Kiali server itself.
The accessible namespaces are defined by a list of regex expressions that match against the namespace names
visible to the Kiali operator. If left unset, the Kiali server will be given access to all namespaces in
the cluster.
The list of accessible namespaces is specified in the Kiali CR via the
accessible_namespaces setting, under the main deployment section. As an
example, if Kiali is to be installed in the istio-system namespace, and is
expected to monitor all namespaces prefixed with mycorp_, the setting would
be:
spec:
  deployment:
    accessible_namespaces:
    - istio-system
    - mycorp_.*
When you set accessible_namespaces to a list of namespaces as the example above illustrates, by default the operator will create a Role for each accessible namespace. Each Role will be assigned to the Kiali Service Account thus providing Kiali permissions to those namespaces. To change that default behavior, deployment.cluster_wide_access can be set to true. This will tell the operator not to create these Roles and just create a single ClusterRole and assign it to the Kiali Server (see below).
Because Kiali server utilizes Kubernetes watches to watch all namespaces in deployment.accessible_namespaces, this may cause performance issues. To increase performance you can set deployment.cluster_wide_access to true when specifying a list of namespaces in accessible_namespaces. When you do this, the Kiali Server will be given access to the entire cluster and thus it can use a single cluster watch which increases performance and efficiency. However, you must be aware that when you do this, the Kiali Server will be granted access to the cluster via a ClusterRole - individual Roles will not be created per namespace. The deployment.accessible_namespaces will still be used to determine which namespaces to make available to users.
If you install Kiali using the
Server Helm Chart, these Roles will not be created. This security feature is provided by the operator only, and is one reason why it is recommended to use the operator. The Server Helm Chart is provided only as a convenience.
Note that the namespaces declared here (including any regex expressions) are evaluated and discovered by the operator at install time. Namespaces that do not exist at the time of install will not be accessible to Kiali until the operator has a chance to reconcile the Kiali CR (which should happen fairly quickly after the new namespace is created). Adding the new namespace to the list of accessible_namespaces will also trigger the operator to reconcile the Kiali CR. When the operator reconciles the Kiali CR, the necessary Role will be created giving the Kiali Server access to the new namespace.
As you can see in the example, the namespace where Kiali is installed must be listed as accessible (often, but not always, this is the same namespace as the Istio control plane namespace). If it is not in the list, it will be added for you by the operator.
As mentioned earlier, if you leave accessible_namespaces unset, this denotes that the Kiali server is given access to all namespaces in the cluster, including any namespaces that are created in the future. If you do this, individual Roles are not created per namespace; instead a single ClusterRole is created and assigned to the Kiali Service Account thus providing Kiali access to all namespaces in the cluster.
If you install the operator using the
Helm Charts, to be able to use this default
accessible_namespaces behavior, you must specify the
--set clusterRoleCreator=true flag when invoking
helm install.
When installing multiple Kiali instances into a single cluster,
accessible_namespaces must be mutually exclusive. In other words, a namespace
set must be matched by only one Kiali CR. Regular expressions must not have
overlapping patterns.
A cluster can have at most one Kiali instance with accessible_namespaces unset.
Maistra supports multi-tenancy and the accessible_namespaces extends that
feature to Kiali. However, explicit naming of accessible namespaces can benefit
non-Maistra installations as well - with it Kiali does not need cluster roles
and the Kiali Operator does not need permissions to create cluster roles.
Istio Discovery Selectors
In Istio’s MeshConfig, you can provide a list of discovery selectors that Istio will consider when processing namespaces. The Kiali server will also utilize these same discovery selectors when determining which namespaces to make available to users. Therefore, these discovery selectors work in conjunction with the accessible_namespaces setting. The accessible_namespaces setting dictates which namespaces are accessible to the Kiali Server, and hence to users of Kiali. The Istio discovery selectors tell Kiali to make available to users those namespaces within the accessible_namespaces list. So discovery selectors are a subset of accessible_namespaces.
You must make sure you configure accessible_namespaces with a list of namespaces that are equal to, or are a superset of, the namespaces that result from evaluating the Istio discovery selectors.
Included Namespaces
This feature is deprecated as of 1.67. It is recommended to instead use Istio Discovery Selectors.
When accessible_namespaces is unset, you can still limit the namespaces a user will see in Kiali. The api.namespaces.include setting allows you to configure the subset of namespaces that Kiali will show the user. This list is specified in a way similar to accessible_namespaces, as a list of namespaces that can include regex patterns. The difference is that this list is processed by the server, not the operator, each time the list of namespaces needs to be obtained by Kiali. This means it will handle namespaces that exist when Kiali is installed, or namespaces created later.
spec:
  api:
    namespaces:
      include:
      - istio-system
      - mycorp_.*
  deployment: {}
The api.namespaces.include setting is ignored if accessible_namespaces is set.
The api.namespaces.include will implicitly include the control plane namespace (e.g. istio-system) even if you do not explicitly specify it in the list.
Note that this setting is merely a filter and does not provide security in any way.
Excluded Namespaces
This feature is deprecated as of 1.67. It is recommended to instead use Istio Discovery Selectors.
The api.namespaces.exclude setting configures namespaces to exclude from being shown to the user. This setting can be used both when accessible_namespaces is unset or set to an explicit list of namespaces. It can also be used regardless of whether api.namespaces.include is defined. The exclude filter has precedence - if a namespace matches any regex pattern defined for api.namespaces.exclude, it will not be shown in Kiali. Like api.namespaces.include, the exclude setting is only a filter and does not provide security in any way.
For example, if the accessible_namespaces configuration includes mycorp_.* but it is not desirable to see test namespaces, the following configuration can be used:
spec:
  api:
    namespaces:
      exclude:
      - mycorp_test.*
  deployment:
    accessible_namespaces:
    - istio-system
    - mycorp_.*
You cannot exclude the control plane namespace. If you specify it in api.namespaces.exclude, it will be ignored.
Namespace Selectors
This feature is deprecated as of 1.67. It is recommended to instead use Istio Discovery Selectors.
In addition to the Include and Exclude lists (as explained above), Kiali supports optional Kubernetes label selectors for both including and excluding namespaces.
The include label selector is defined in the Kiali CR setting api.namespaces.label_selector_include.
The exclude label selector is defined in the Kiali CR setting api.namespaces.label_selector_exclude.
The example below selects all namespaces that have a label kiali-enabled: true:
spec:
  api:
    namespaces:
      label_selector_include: kiali-enabled=true
  deployment: {}
The example below hides all namespaces that have a label infrastructure: system:
spec:
  api:
    namespaces:
      label_selector_exclude: infrastructure=system
Important Note About label_selector_include
It is very important to understand how the api.namespaces.label_selector_include setting is used when deployment.accessible_namespaces is set to an explicit list of namespaces versus when it is unset.
When accessible_namespaces is unset then label_selector_include simply provides a filter just like api.namespaces.include. The difference is that label_selector_include filters by namespace label whereas include filters by namespace name. Thus, label_selector_include provides an additional way to limit which namespaces the Kiali user will see when accessible_namespaces is unset.
It is recommended to leave label_selector_include unset when accessible_namespaces is set to an explicit list of namespaces. This is because the operator adds the configured label (name and value) to each namespace defined by accessible_namespaces. This allows the Kiali code to use the label_selector_include value to easily select all of the accessible_namespaces. Unless you have a good reason to customize, the default value is highly recommended in this scenario.
If Kiali is installed via the Server Helm Chart, labels are not added to the accessible namespaces. The user must ensure api.namespaces.label_selector_include (if defined) selects all namespaces declared in accessible_namespaces (when unset). It is a user-error if this is not configured correctly.
For further information on how this api.namespaces.label_selector_include interacts with deployment.accessible_namespaces read the Kiali CR Reference documentation.
Soft Multi-Tenancy
When deploying multiple control planes in the same cluster, the label_selector_include’s value must be unique to each control plane. This allows each Kiali instance to select only the namespaces relevant to each control plane. Thus you can have multiple control planes in the same cluster, with each control plane having its own Kiali instance. In this “soft-multitenancy” mode, deployment.accessible_namespaces is typically set to an explicit set of namespaces. In that case, you do not have to do anything with this label_selector_include because the default value of label_selector_include is kiali.io/member-of: <spec.istio_namespace>. If you set your own Kiali instance name in the Kiali CR (i.e. you set deployment.instance_name to something other than kiali), then the default will be kiali.io/<spec.deployment.instance_name>.member-of: <spec.istio_namespace>.
9 - No Istiod Access
Kiali behavior with no access to Istiod (the /debug endpoints are not available)
Introduction
Kiali makes use of the Istiod /debug endpoints for introspection into the control plane. If this API is unavailable Kiali continues to perform, but the feature set will be degraded. The Istio API can be unavailable for various reasons:
- The Istio API has been explicitly disabled in the Istio configuration.
- The deployment model prevents access to the Istio API (firewalls, other networking concerns or limitations).
- The API is configured but for some, potentially unexpected, reason can not be reached by Kiali.
Configuration
When the Istio API is known to be inaccessible Kiali should be configured via the istio_api_enabled configuration item.
By default, istio_api_enabled is true.
# ...
spec:
external_services:
  istio:
    istio_api_enabled: false
# ...
How does it affect Kiali
When the Istio API is not available there is expected feature degradation in Kiali:
- The control plane metrics won’t be available.
- The proxy status won’t be available in the workloads details view.
- The Istio validations may not be available.
- The Kiali validations will not be available.
- The Istio Registry Services that are not present in the Kubernetes list won’t be available.
Note that Istio Configurations will be available. This is because the list of Istio configurations is obtained using the Kubernetes API.

Istio Validations
The Istio validations won’t be available as this logic is provided by the Istio API.
But, if the Istio Config was created when the validatingwebhookconfiguration web hook was enabled, the validation messages will be available and the Istio validations can be found:
The Kiali validations won’t be available, as they are degraded, so they have been disabled too.
Istio Registry Services
The Istio Registry Services won’t be available in the service list when the Istio API is disabled.
The following image shows a service list when Istio API is enabled:
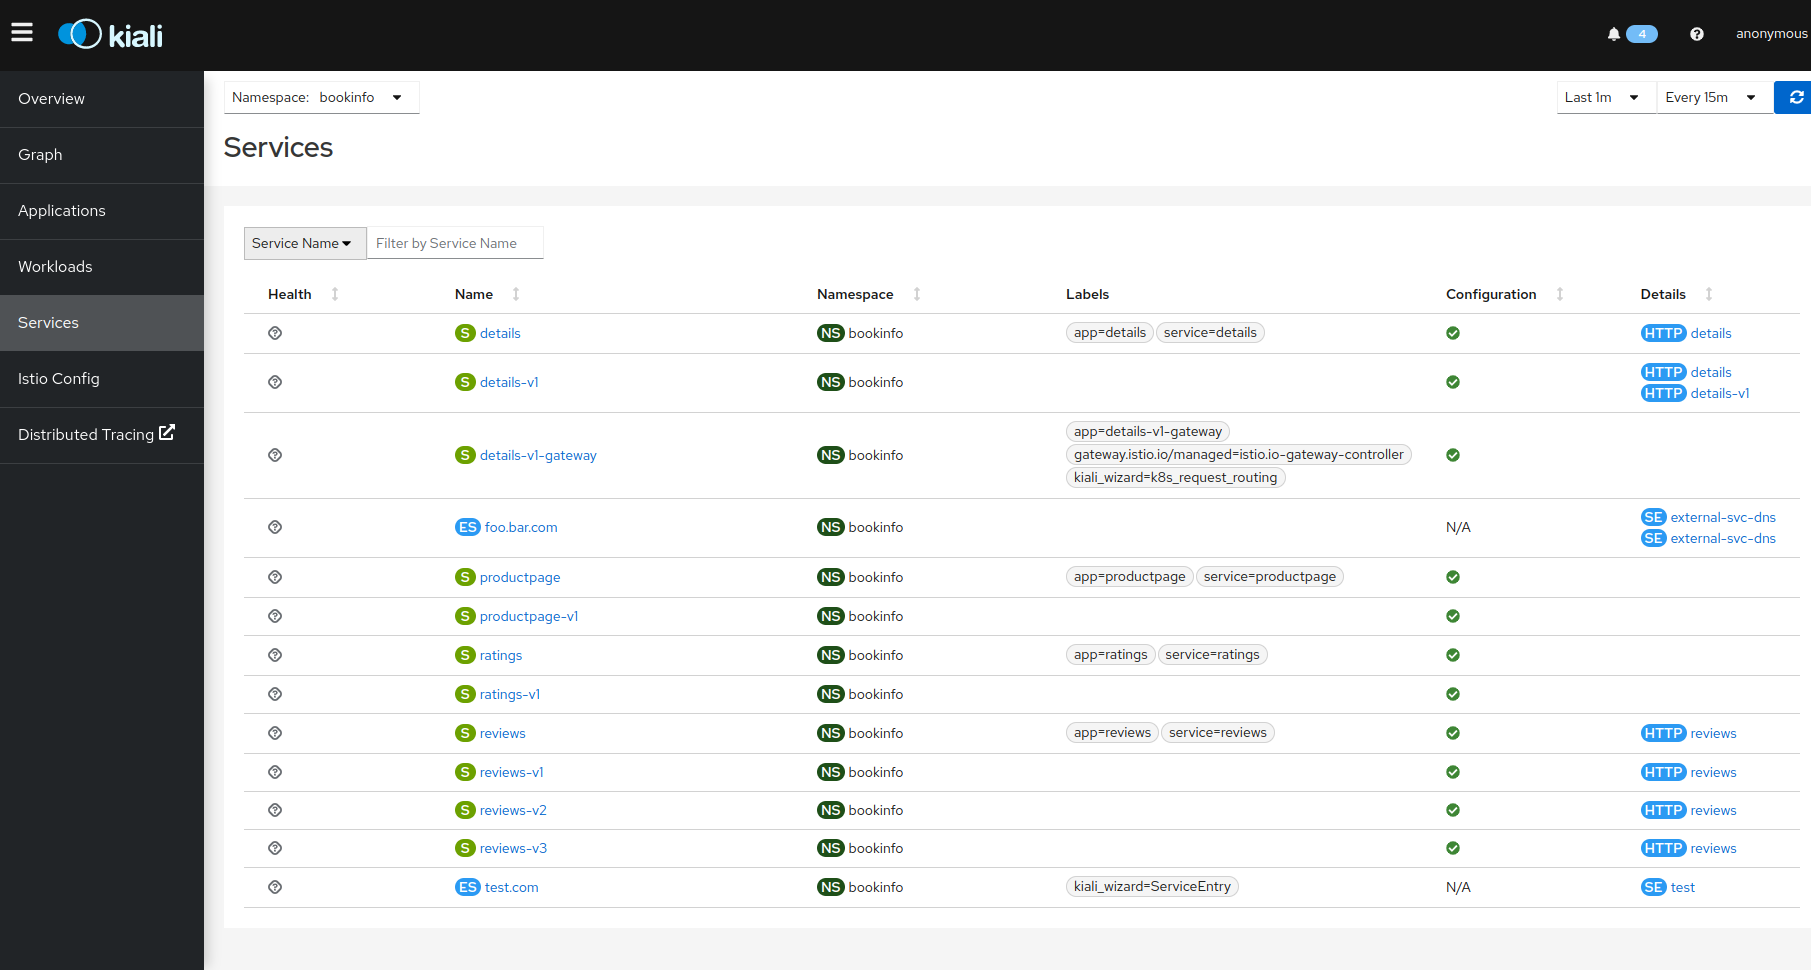
The following image shows the same list when it is disabled:
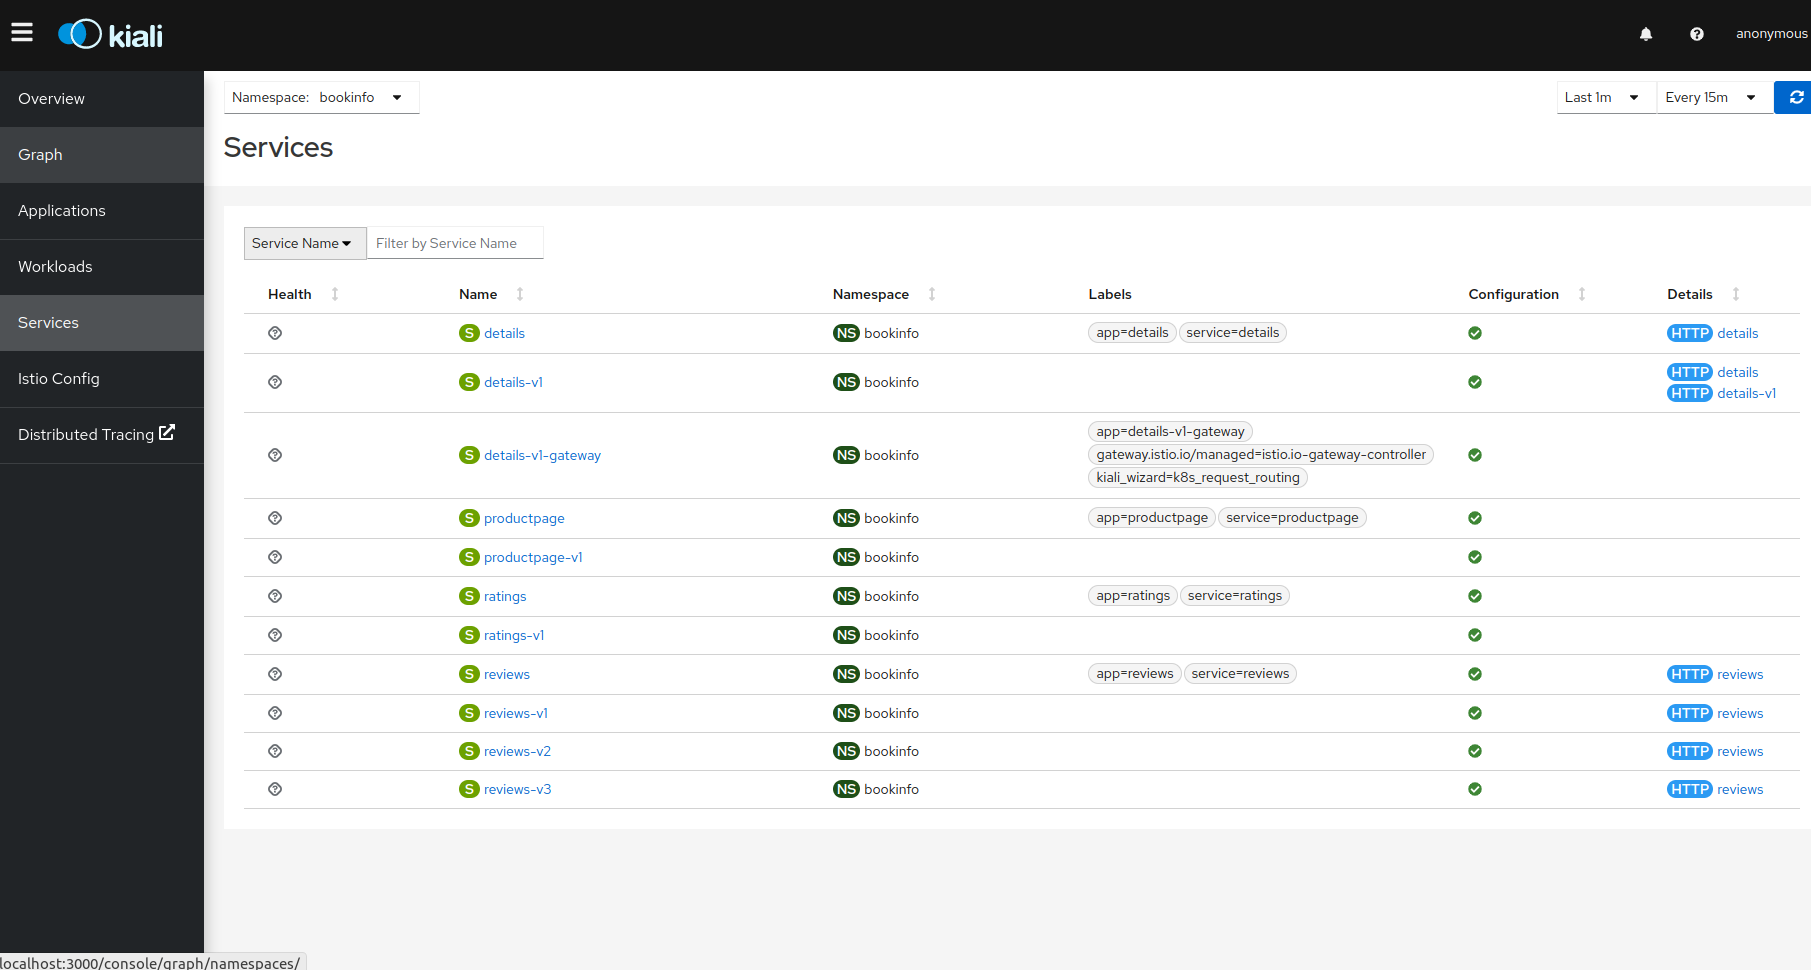
Istio Configurations
The Istio Configurations are available in view and edit mode.
It is important to know that the validations are disabled, so the configurations created or modified won’t be validated.
There is one scenario where the creation/deletion/edition could fail: If the Istio validation webhook is enabled but the Istio registry is not available. In this case, the webhook should be removed in order for this to work.
It can be checked with the following command:
kubectl get ValidatingWebhookConfiguration
10 - Prometheus, Jaeger, Grafana
Kiali data sources and add-ons.
Prometheus is a required telemetry data source for Kiali. Jaeger is a highly recommended tracing data source. Kiali also offers a simple Grafana add-on integration. This page describes how to configure Kiali to communicate with these dependencies.
Read the dedicated configuration page to learn more.
10.1 - Grafana
This page describes how to configure Grafana for Kiali.
Grafana configuration
Istio provides preconfigured Grafana
dashboards for the
most relevant metrics of the mesh. Although Kiali offers similar views in its
metrics dashboards, it is not in Kiali’s goals to provide the advanced querying
options, nor the highly customizable settings, that are available in Grafana.
Thus, it is recommended that you use Grafana if you need those advanced
options.
Kiali can provide a direct link from its metric dashboards to the equivalent or
most similar Grafana dashboard, which is convenient if you need the powerful
Grafana options. For these links to appear in Kiali you need to manually
configure the Grafana URL and the dashboards that come preconfigured with Istio, like in the following example:
Kiali will query Grafana and try to fetch the configured dashboards. For this reason Kiali must be able to reach Grafana, authenticate, and find the Istio dashboards. The Istio dashboards must be installed in Grafana for the links to appear in Kiali.
spec:
  external_services:
    grafana:
      enabled: true
      # Grafana service name is "grafana" and is in the "telemetry" namespace.
      in_cluster_url: 'http://grafana.telemetry:3000/'
      # Public facing URL of Grafana
      url: 'http://my-ingress-host/grafana'
      dashboards:
      - name: "Istio Service Dashboard"
        variables:
          namespace: "var-namespace"
          service: "var-service"
      - name: "Istio Workload Dashboard"
        variables:
          namespace: "var-namespace"
          workload: "var-workload"
      - name: "Istio Mesh Dashboard"
      - name: "Istio Control Plane Dashboard"
      - name: "Istio Performance Dashboard"
      - name: "Istio Wasm Extension Dashboard"
The described configuration is done in the Kiali CR when Kiali is installed using the Kiali Operator. If Kiali is installed with the Helm chart then the correct way to configure this is via regular –set flags.
10.2 - Jaeger
This page describes how to configure Jaeger for Kiali.
Jaeger configuration
Jaeger is a highly recommended service because Kiali uses distributed
tracing data for several features,
providing an enhanced experience.
By default, Kiali will try to reach Jaeger at the GRPC-enabled URL of the form
http://tracing.<istio_namespace_name>:16685/jaeger, which is the usual case
if you are using the Jaeger Istio
add-on.
If this endpoint is unreachable, Kiali will disable features that use
distributed tracing data.
If your Jaeger instance has a different service name or is installed to a
different namespace, you must manually provide the endpoint where it is
available, like in the following example:
spec:
  external_services:
    tracing:
      # Enabled by default. Kiali will anyway fallback to disabled if
      # Jaeger is unreachable.
      enabled: true
      # Jaeger service name is "tracing" and is in the "telemetry" namespace.
      # Make sure the URL you provide corresponds to the non-GRPC enabled endpoint
      # if you set "use_grpc" to false.
      in_cluster_url: "http://tracing.telemetry:16685/jaeger"
      use_grpc: true
      # Public facing URL of Jaeger
      url: "http://my-jaeger-host/jaeger"
Minimally, you must provide spec.external_services.tracing.in_cluster_url to
enable Kiali features that use distributed tracing data. However, Kiali can
provide contextual links that users can use to jump to the Jaeger console to
inspect tracing data more in depth. For these links to be available you need to
set the spec.external_services.tracing.url which may mean that you should
expose Jaeger outside the cluster.
Default values for connecting to Jaeger are based on the
Istio’s provided
sample add-on manifests.
If your Jaeger setup differs significantly from the sample add-ons, make sure
that Istio is also properly configured to push traces to the right URL.
Use Jaeger frontend with Grafana Tempo tracing backend
It is possible to use the Grafana Tempo tracing backend exposing the Jaeger API.
tempo-query is a
Jaeger storage plugin. It accepts the full Jaeger query API and translates these
requests into Tempo queries.
Since Tempo is not yet part of the built-in addons that are part of Istio, you
need to manage your Tempo instance.
Tanka
The official Grafana Tempo documentation
explains how to deploy a Tempo instance using Tanka. You
will need to tweak the settings from the default Tanka configuration to:
- Expose the Zipkin collector
- Expose the GRPC Jaeger Query port
When the Tempo instance is deployed with the needed configurations, you have to
set
meshConfig.defaultConfig.tracing.zipkin.address
from Istio to the Tempo Distributor service and the Zipkin port. Tanka will deploy
the service in distributor.tempo.svc.cluster.local:9411.
The in_cluster_url Kiali option needs to be set to'
http://query-frontend.tempo.svc.cluster.local:16685.
Tempo Operator
The Tempo Operator for Kubernetes
provides a native Kubernetes solution to deploy Tempo easily in your system.
After installing the Tempo Operator in your cluster, you can create a new
Tempo instance with the following CR:
kubectl create namespace tempo
kubectl apply -n tempo -f - <<EOF
apiVersion: tempo.grafana.com/v1alpha1
kind: TempoStack
metadata:
  name: smm
spec:
  storageSize: 1Gi
  storage:
    secret:
      type: s3
      name: object-storage
  resources:
    total:
      limits:
        memory: 2Gi
        cpu: 2000m
  template:
    queryFrontend:
      jaegerQuery:
        enabled: true
        ingress:
          type: ingress
EOF
Note the name of the bucket where the traces will be stored in our example is
called object-storage. Check the
Tempo Operator
documentation to know more about what storages are supported and how to create
the secret properly to provide it to your Tempo instance.
Now, you are ready to configure the
meshConfig.defaultConfig.tracing.zipkin.address
field in your Istio installation. It needs to be set to the 9411 port of the
Tempo Distributor service. For the previous example, this value will be
tempo-smm-distributor.tempo.svc.cluster.local:9411.
Now, you need to configure the in_cluster_url setting from Kiali to access
the Jaeger API. You can point to the 16685 port to use GRPC or 16686 if not.
For the given example, the value would be
http://tempo-ssm-query-frontend.tempo.svc.cluster.local:16685.
There is a related tutorial with detailed instructions to setup Kiali and Grafana Tempo with the Operator.
10.3 - Prometheus
This page describes how to configure Prometheus for Kiali.
Prometheus configuration
Kiali requires Prometheus to generate the
topology graph,
show metrics,
calculate health and
for several other features. If Prometheus is missing or Kiali
can’t reach it, Kiali won’t work properly.
By default, Kiali assumes that Prometheus is available at the URL of the form
http://prometheus.<istio_namespace_name>:9090, which is the usual case if you
are using the Prometheus Istio
add-on.
If your Prometheus instance has a different service name or is installed in a
different namespace, you must manually provide the endpoint where it is
available, like in the following example:
spec:
  external_services:
    prometheus:
      # Prometheus service name is "metrics" and is in the "telemetry" namespace
      url: "http://metrics.telemetry:9090/"
Notice that you don’t need to expose Prometheus outside the cluster. It is
enough to provide the Kubernetes internal service URL.
Kiali maintains an internal cache of some Prometheus queries to improve
performance (mainly, the queries to calculate Health indicators). It
would be very rare to see data delays, but should you notice any delays you may
tune caching parameters to values that work better for your environment.
See the Kiali CR reference page for the current default values.
Compatibility with Prometheus-like servers
Although Kiali assumes a Prometheus server and is tested against it, there are
TSDBs that can be used as a Prometheus
replacement despite not implementing the full Prometheus API.
Community users have faced two issues when using Prometheus-like TSDBs:
- Kiali may report that the TSDB is unreachable, and/or
- Kiali may show empty metrics if the TSBD does not implement the
/api/v1/status/config.
To fix these issues, you may need to provide a custom health check endpoint for
the TSDB and/or manually provide the configurations that Kiali reads from the
/api/v1/status/config API endpoint:
spec:
  external_services:
    prometheus:
      # Fix the "Unreachable" metrics server warning.
      health_check_url: "http://custom-tsdb-health-check-url"
      # Fix for the empty metrics dashboards
      thanos_proxy:
        enabled: true
        retention_period: "7d"
        scrape_interval: "30s"
Prometheus Tuning
Production environments should not be using the Istio Prometheus add-on, or carrying over its configuration settings. That is useful only for small, or demo installations. Instead, Prometheus should have been installed in a production-oriented way, following the Prometheus documentation.
This section is primarily for users where Prometheus is being used specifically for Kiali, and possible optimizations that can be made knowing that Kiali does not utilize all of the default Istio and Envoy telemetry.
Metric Thinning
Istio and Envoy generate a large amount of telemetry for analysis and troubleshooting. This can result in significant resources being required to ingest and store the telemetry, and to support queries into the data. If you use the telemetry specifically to support Kiali, it is possible to drop unnecessary metrics and unnecessary labels on required metrics. This FAQ Entry displays the metrics and attributes required for Kiali to operate.
To reduce the default telemetry to only what is needed by Kiali users can add the following snippet to their Prometheus configuration. Because things can change with different versions, it is recommended to ensure you use the correct version of this documentation based on your Kiali/Istio version.
The metric_relabel_configs: attribute should be added under each job name defined to scrape Istio or Envoy metrics. Below we show it under the kubernetes-pods job, but you should adapt as needed. Be careful of indentation.
    - job_name: kubernetes-pods
      metric_relabel_configs:
      - action: drop
        source_labels: [__name__]
        regex: istio_agent_.*|istiod_.*|istio_build|citadel_.*|galley_.*|pilot_[^p].*|envoy_cluster_[^u].*|envoy_cluster_update.*|envoy_listener_[^dh].*|envoy_server_[^mu].*|envoy_wasm_.*
      - action: labeldrop
        regex: chart|destination_app|destination_version|heritage|.*operator.*|istio.*|release|security_istio_io_.*|service_istio_io_.*|sidecar_istio_io_inject|source_app|source_version
Applying this configuration should reduce the number of stored metrics by about 20%, as well as reducing the number of attributes stored on many remaining metrics.
Metric Thinning with Crippling
The section above drops metrics unused by Kiali. As such, making those configuration changes should not negatively impact Kiali behavior in any way. But some very heavy metrics remain. These metrics can also be dropped, but their removal will impact the behavior of Kiali. This may be OK if you don’t use the affected features of Kiali, or if you are willing to sacrifice the feature for the associated metric savings. In particular, these are “Histogram” metrics. Istio is planning to make some improvements to help users better configure these metrics, but as of this writing they are still defined with fairly inefficient default “buckets”, making the number of associated time-series quite large, and the overhead of maintaining and querying the metrics, intensive. Each histogram actually is comprised of 3 stored metrics. For example, a histogram named xxx would result in the following metrics stored into Prometheus:
xxx_bucket
- The most intensive metric, and is required to calculate percentile values.
xxx_count
- Required to calculate ‘avg’ values.
xxx_sum
- Required to calculate rates over time, and for ‘avg’ values.
When considering whether to thin the Histogram metrics, one of the following three approaches is recommended:
- If the relevant Kiali reporting is needed, keep the histogram as-is.
- If the relevant Kiali reporting is not needed, or not worth the additional metric overhead, drop the entire histogram.
- If the metric chart percentiles are not required, drop only the xxx_bucket metric. This removes the majority of the histogram overhead while keeping rate and average (non-percentile) values in Kiali.
These are the relevant Histogram metrics:
istio_request_bytes
This metric is used to produce the Request Size chart on the metric tabs. It also supports Request Throughput edge labels on the graph.
- Appending
|istio_request_bytes_.* to the drop regex above would drop all associated metrics and would prevent any request size/throughput reporting in Kiali.
- Appending
|istio_request_bytes_bucket to the drop regex above, would prevent any request size percentile reporting in the Kiali metric charts.
istio_response_bytes
This metric is used to produce the Response Size chart on the metric tabs. And also supports Response Throughput edge labels on the graph
- Appending
|istio_response_bytes_.* to the drop regex above would drop all associated metrics and would prevent any response size/throughput reporting in Kiali.
- Appending
|istio_response_bytes_bucket to the drop regex above would prevent any response size percentile reporting in the Kiali metric charts.
istio_request_duration_milliseconds
This metric is used to produce the Request Duration chart on the metric tabs. It also supports Response Time edge labels on the graph.
- Appending
|istio_request_duration_milliseconds_.* to the drop regex above would drop all associated metrics and would prevent any request duration/response time reporting in Kiali.
- Appending
|istio_request_duration_milliseconds_bucket to the drop regex above would prevent any request duration/response time percentile reporting in the Kiali metric charts or graph edge labels.
Scrape Interval
The Prometheus globalScrapeInterval is an important configuration option. The scrape interval can have a significant effect on metrics collection overhead as it takes effort to pull all of those configured metrics and update the relevant time-series. And although it doesn’t affect time-series cardinality, it does affect storage for the data-points, as well as having impact when computing query results (the more data-points, the more processing and aggregation).
Users should think carefully about their configured scrape interval. Note that the Istio addon for prometheus configures it to 15s. This is great for demos but may be too frequent for production scenarios. The prometheus helm charts set a default of 1m, which is more reasonable for most installations, but may not be the desired frequency for any particular setup.
The recommendation for Kiali is to set the longest interval possible, while still providing a useful granularity. The longer the interval the less data points scraped, thus reducing processing, storage, and computational overhead. But the impact on Kiali should be understood. It is important to realize that request rates (or byte rates, message rates, etc) require a minumum of two data points:
rate = (dp2 - dp1) / timePeriod
That means for Kiali to show anything useful in the graph, or anywhere rates are used (many places), the minimum duration must be >= 2 x globalScrapeInterval. Kiali will eliminate invalid Duration options given the globalScrapeInterval.
Kiali does a lot of aggregation and querying over time periods. As such, the number of data points will affect query performance, especially for larger time periods.
For more information, see the Prometheus documentation.
TSDB retention time
The Prometheus tsdbRetentionTime is an important configuration option. It has a significant effect on metrics storage, as Prometheus will keep each reported data-point for that period of time, performing compaction as needed. The larger the retention time, the larger the required storage. Note also that Kiali queries against large time periods, and very large data-sets, may result in poor performance or timeouts.
The recommendation for Kiali is to set the shortest retention time that meets your needs and/or operational limits. In some cases users may want to offload older data to a secondary store. Kiali will eliminate invalid Duration options given the tsdbRetentionTime.
For more information, see the Prometheus documentation.
11 - Traffic Health
Customizing Health for Request Traffic.
There are times when Kiali’s default thresholds for traffic health do not work well for a particular situation. For example, at times 404 response codes are expected. Kiali has the ability to set powerful, fine-grained overrides for health configuration.
Default Configuration
By default Kiali uses the traffic rate configuration shown below. Application errors have minimal tolerance while client errors have a higher tolerance reflecting that some level of client errors is often normal (e.g. 404 Not Found):
- For http protocol 4xx are client errors and 5xx codes are application errors.
- For grpc protocol all 1-16 are errors (0 is success).
So, for example, if the rate of application errors is >= 0.1% Kiali will show Degraded health and if > 10% will show Failure health.
# ...
  health_config:
    rate:
      - namespace: ".*"
        kind: ".*"
        name: ".*"
        tolerance:
          - code: "^5\\d\\d$"
            direction: ".*"
            protocol: "http"
            degraded: 0
            failure: 10
          - code: "^4\\d\\d$"
            direction: ".*"
            protocol: "http"
            degraded: 10
            failure: 20
          - code: "^[1-9]$|^1[0-6]$"
            direction: ".*"
            protocol: "grpc"
            degraded: 0
            failure: 10
# ...
Custom Configuration
Custom health configuration is specified in the Kiali CR. To see the supported configuration syntax for health_config see the Kiali CR Reference.
Kiali applies the first matching rate configuration (namespace, kind, etc) and calculates the status for each tolerance. The reported health will be the status with highest priority (see below).
| Rate Option | Definition | Default |
| namespace | Matching Namespaces (regex) | .* (match all) |
| kind | Matching Resource Types (workload|app|service) (regex) | .* (match all) |
| name | Matching Resource Names (regex) | .* (match all) |
| tolerance | Array of tolerances to apply. |
| Tolerance Option |
Definition |
Default |
| code |
Matching Response Status Codes (regex) [1] |
required |
| direction |
Matching Request Directions (inbound|outbound) (regex) |
.* (match all) |
| protocol |
Matching Request Protocols (http|grpc) (regex) |
.* (match all) |
| degraded |
Degraded Threshold(% matching requests >= value) |
0 |
| failure |
Failure Threshold (% matching requests >= value) |
0 |
[1] The status code typically depends on the request protocol. The special code -, a single dash, is used for requests that don’t receive a response, and therefore no response code.
Kiali reports traffic health with the following top-down status priority :
| Priority |
Rule (value=% matching requests) |
Status |
| 1 |
value >= FAILURE threshold |
 FAILURE FAILURE |
| 2 |
value >= DEGRADED threshold AND value < FAILURE threshold |
 DEGRADED DEGRADED |
| 3 |
value > 0 AND value < DEGRADED threshold |
 HEALTHY HEALTHY |
| 4 |
value = 0 |
 HEALTHY HEALTHY |
| 5 |
No traffic |
 No Health Information No Health Information |
Examples
These examples use the repo https://github.com/kiali/demos/tree/master/error-rates.
In this repo we can see 2 namespaces: alpha and beta (Demo design).
| Alpha |

|
Where nodes return the responses (You can configure responses here):
| App (alpha/beta) |
Code |
Rate |
| x-server |
200 |
9 |
| x-server |
404 |
1 |
| y-server |
200 |
9 |
| y-server |
500 |
1 |
| z-server |
200 |
8 |
| z-server |
201 |
1 |
| z-server |
201 |
1 |
The applied traffic rate configuration is:
# ...
health_config:
  rate:
   - namespace: "alpha"
     tolerance:
       - code: "404"
         failure: 10
         protocol: "http"
       - code: "[45]\\d[^\\D4]"
         protocol: "http"
   - namespace: "beta"
     tolerance:
       - code: "[4]\\d\\d"
         degraded: 30
         failure: 40
         protocol: "http"
       - code: "[5]\\d\\d"
         protocol: "http"
# ...
After Kiali adds default configuration we have the following (Debug Info Kiali):
{
  "healthConfig": {
    "rate": [
      {
        "namespace": "/alpha/",
        "kind": "/.*/",
        "name": "/.*/",
        "tolerance": [
          {
            "code": "/404/",
            "degraded": 0,
            "failure": 10,
            "protocol": "/http/",
            "direction": "/.*/"
          },
          {
            "code": "/[45]\\d[^\\D4]/",
            "degraded": 0,
            "failure": 0,
            "protocol": "/http/",
            "direction": "/.*/"
          }
        ]
      },
      {
        "namespace": "/beta/",
        "kind": "/.*/",
        "name": "/.*/",
        "tolerance": [
          {
            "code": "/[4]\\d\\d/",
            "degraded": 30,
            "failure": 40,
            "protocol": "/http/",
            "direction": "/.*/"
          },
          {
            "code": "/[5]\\d\\d/",
            "degraded": 0,
            "failure": 0,
            "protocol": "/http/",
            "direction": "/.*/"
          }
        ]
      },
      {
        "namespace": "/.*/",
        "kind": "/.*/",
        "name": "/.*/",
        "tolerance": [
          {
            "code": "/^5\\d\\d$/",
            "degraded": 0,
            "failure": 10,
            "protocol": "/http/",
            "direction": "/.*/"
          },
          {
            "code": "/^4\\d\\d$/",
            "degraded": 10,
            "failure": 20,
            "protocol": "/http/",
            "direction": "/.*/"
          },
          {
            "code": "/^[1-9]$|^1[0-6]$/",
            "degraded": 0,
            "failure": 10,
            "protocol": "/grpc/",
            "direction": "/.*/"
          }
        ]
      }
    ]
  }
}
What are we applying?
-
For namespace alpha, all resources
-
Protocol http if % requests with error code 404 are >= 10 then FAILURE, if they are > 0 then DEGRADED
-
Protocol http if % requests with others error codes are> 0 then FAILURE.
-
For namespace beta, all resources
-
Protocol http if % requests with error code 4xx are >= 40 then FAILURE, if they are >= 30 then DEGRADED
-
Protocol http if % requests with error code 5xx are > 0 then FAILURE
-
For other namespaces Kiali will apply the defaults.
-
Protocol http if % requests with error code 5xx are >= 20 then FAILURE, if they are >= 0.1 then DEGRADED
-
Protocol grpc if % requests with error code match /^[1-9]$|^1[0-6]$/ are >= 20 then FAILURE, if they are >= 0.1 then DEGRADED
| Alpha |
Beta |
 |
 |
12 - Virtual Machine workloads
Ensuring Kiali can visualize a VM WorkloadEntry.
Introduction
Kiali graph visualizes both Virtual Machine workloads (WorkloadEntry) and pod-based workloads, running inside a Kubernetes cluster. You must ensure that the Istio Proxy is running, and correctly configured, on the Virtual Machine. Also, Prometheus must be able to scrape the metrics endpoint of the Istio Proxy running on the VM. Kiali will then be able to read the traffic telemetry for the Virtual Machine workloads, and incorporate the VM workloads into the graph.
Kiali does not currently distinguish between pod-based and VM-based workloads nor does Kiali support viewing additional details for the VM-based workloads beyond what is displayed on the graph. One way to distinguish between the two is to give the VM-based workloads a different version label than the pod-based workloads.
Configuring Prometheus to scrape VM-based Istio Proxy
Once the Istio Proxy is running on a Virtual Machine, configuring Prometheus to scrape the VM’s Istio Proxy metrics endpoint is the only configuration Kiali needs to display traffic for the VM-based workload.
Configuring Prometheus will vary between environments. Here is a very simple example of a Prometheus configuration that includes a job to scrape VM based workloads:
- job_name: bookinfo-vms
  honor_timestamps: true
  scrape_interval: 15s
  scrape_timeout: 10s
  metrics_path: /stats/prometheus
  scheme: http
  follow_redirects: true
  static_configs:
  - targets:
    - details-v1:15020
    - productpage-v1:15020
    - ratings-v1:15020
    - reviews-v1:15020
    - reviews-v2:15020
    - reviews-v3:15020


 FAILURE
 DEGRADED
 HEALTHY
 No Health Information